
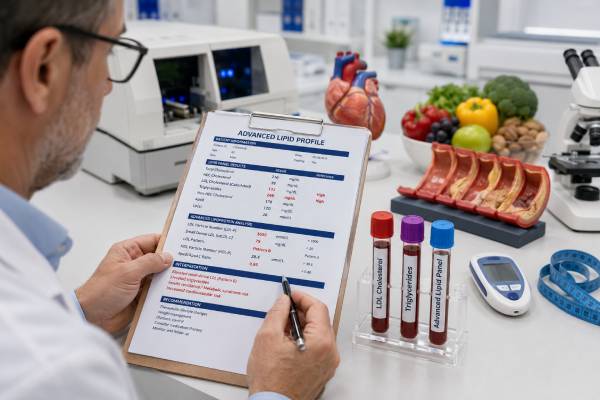
Small dense LDL is a type of LDL particle that tends to appear when triglycerides are high, HDL cholesterol is low, and insulin resistance is present. This pattern is often called LDL Pattern B, meaning LDL particles are smaller and denser rather than larger and more buoyant. A standard cholesterol panel does not directly show particle size, but it often gives clues: triglycerides above about 150 mg/dL, low HDL, high non-HDL cholesterol, high ApoB, or a high triglyceride/HDL ratio can point toward the same metabolic pattern. Small dense LDL is not a separate disease, and it should not be interpreted alone. It is one part of a broader risk picture that includes LDL particle number, ApoB, blood pressure, glucose control, waist size, smoking, kidney function, family history, and prior cardiovascular disease.
- Small dense LDL usually means LDL particles are smaller, denser, and commonly linked with high triglycerides, low HDL, insulin resistance, metabolic syndrome, or type 2 diabetes.
- Pattern B describes a predominance of small dense LDL particles; Pattern A describes mostly larger, more buoyant LDL particles.
- Triglycerides of 150 mg/dL or higher often suggest triglyceride-rich lipoprotein excess, while 500 mg/dL or higher raises concern for pancreatitis risk.
- ApoB or LDL particle number often matters more than LDL size alone because particle count reflects how many atherogenic particles can enter artery walls.
- Fasting testing is often helpful when triglycerides are high, results are borderline, or an advanced lipid panel is being used to assess particle patterns.
- Follow-up is important when high triglycerides appear with high glucose, high ApoB, fatty liver, high blood pressure, chest pain symptoms, or a strong family history of early heart disease.
Table of Contents
- What Small Dense LDL Means
- Pattern B and Triglycerides
- How Insulin Resistance Creates This Lipid Pattern
- How to Interpret Test Results
- Risk Beyond LDL Cholesterol
- Common Causes and Contributing Factors
- How to Lower Pattern B and Metabolic Lipid Risk
- When to Follow Up With a Clinician
What Small Dense LDL Means
Small dense LDL means that many LDL particles in the blood are relatively small, cholesterol-poor, and dense. LDL particles all carry cholesterol, but they are not identical. Some are larger and more buoyant. Others are smaller and denser. When a lab reports small dense LDL, LDL particle size, or LDL subclass pattern, it is describing the physical distribution of LDL particles rather than only the amount of cholesterol inside them.
LDL cholesterol, often written as LDL-C, measures cholesterol mass. It does not count LDL particles one by one. Two people can have the same LDL-C but very different particle counts. One may carry cholesterol in fewer large particles. Another may carry similar cholesterol in many smaller particles. The second person can have a higher ApoB or LDL particle number even when LDL-C looks similar, because each atherogenic particle carries one ApoB protein.
Small dense LDL is usually discussed in three related ways:
- Particle size: whether LDL particles are mostly large, intermediate, or small.
- Particle number: how many LDL and other ApoB-containing particles are present.
- Metabolic pattern: whether high triglycerides, low HDL, insulin resistance, abdominal weight gain, or high glucose are present.
The third point is often the most useful clinically. Small dense LDL commonly travels with a cluster of metabolic findings. A person may see mildly high triglycerides, low HDL cholesterol, rising fasting glucose, fatty liver, high waist circumference, and higher blood pressure before diabetes is diagnosed. In that setting, the LDL particles often shift toward the smaller, denser Pattern B profile.
Small dense LDL can be measured directly by specialized lipid tests, but it is not part of a basic standard lipid panel. A routine panel reports total cholesterol, LDL-C, HDL-C, triglycerides, and sometimes calculated VLDL cholesterol or non-HDL cholesterol. These numbers can still offer strong clues, especially when triglycerides are high and HDL is low.
Pattern B and Triglycerides
Pattern B means small dense LDL particles predominate. Pattern A means larger, more buoyant LDL particles predominate. Some labs also report an intermediate pattern when results sit between the two.
Triglycerides strongly influence this pattern. When the liver produces more triglyceride-rich VLDL particles, those particles interact with LDL and HDL through normal lipid-transfer processes. LDL can become triglyceride-enriched, and hepatic lipase can then remodel it into smaller, denser LDL particles. At the same time, HDL particles may become smaller and cleared faster, which helps explain why high triglycerides and low HDL often appear together.
A simple way to think about it is this: high triglycerides often signal an oversupply of triglyceride-rich particles. As those particles are processed, they can leave behind remnant particles and promote the formation of smaller LDL particles. This does not mean triglycerides directly “turn into LDL” in a simple one-step process. It means triglyceride-rich lipoprotein metabolism changes the whole particle environment.
The triglyceride range gives practical context:
| Triglyceride level | Usual interpretation | Why it matters for small dense LDL |
|---|---|---|
| Less than 100 mg/dL | Often metabolically favorable, especially with normal glucose and HDL | Pattern A is more likely, though not guaranteed |
| 100–149 mg/dL | Borderline metabolic signal in some people | Particle size may begin shifting if HDL is low or insulin resistance is present |
| 150–499 mg/dL | Mild to moderate hypertriglyceridemia | Pattern B, remnant cholesterol, and ApoB discordance become more likely |
| 500 mg/dL or higher | Severe hypertriglyceridemia | Pancreatitis prevention becomes a major concern, along with cardiovascular risk |
| 1,000 mg/dL or higher | Very severe elevation, often with chylomicron excess | Urgent medical management may be needed to reduce pancreatitis risk |
Triglycerides are also affected by timing. A nonfasting triglyceride result can rise after meals, especially after a meal rich in refined carbohydrate, alcohol, or fat. Many routine lipid panels can be checked nonfasting, but fasting results are often preferred when triglycerides are high, when a calculated LDL-C result may be unreliable, or when an advanced lipid panel is being used.
The triglycerides and HDL pattern is especially useful because it reflects the same metabolic environment that favors Pattern B. High triglycerides with low HDL should prompt a closer look at glucose control, waist circumference, blood pressure, liver enzymes, medications, alcohol intake, and overall cardiovascular risk.
How Insulin Resistance Creates This Lipid Pattern
Insulin resistance means cells do not respond to insulin as efficiently as they should. The pancreas often compensates by producing more insulin. Blood glucose may stay normal for years, but the liver, fat tissue, and muscle are already working under strain.
This strain changes lipid metabolism. In insulin resistance, fat cells release more free fatty acids into the bloodstream. The liver receives those fatty acids and often makes more triglyceride-rich VLDL particles. More VLDL means more substrate for the remodeling process that produces small dense LDL. This is why Pattern B often appears with abdominal obesity, fatty liver, prediabetes, type 2 diabetes, polycystic ovary syndrome, sleep apnea, and metabolic syndrome.
The lipid pattern of insulin resistance often includes:
- High fasting or nonfasting triglycerides
- Low HDL cholesterol
- Increased VLDL cholesterol
- Increased remnant cholesterol
- Higher ApoB or LDL particle number
- Smaller LDL particle size
- Sometimes normal or only mildly high LDL-C
That last point surprises many people. LDL-C may not look dramatic even when particle-related risk is higher. A person with insulin resistance may have LDL-C of 105 mg/dL, triglycerides of 220 mg/dL, HDL of 36 mg/dL, and ApoB of 115 mg/dL. Another person may have the same LDL-C with triglycerides of 70 mg/dL, HDL of 62 mg/dL, and ApoB of 80 mg/dL. The LDL-C is the same, but the metabolic and particle pattern is not.
Insulin resistance can be assessed in several ways. Fasting glucose and hemoglobin A1c are common screening tests, but they may miss early compensation. A fasting insulin test can show whether the body is using unusually high insulin to maintain glucose. HOMA-IR combines fasting insulin and fasting glucose into an estimated insulin resistance score; a HOMA-IR result can be helpful when interpreted with the full clinical picture.
No single insulin resistance marker is perfect. Acute illness, sleep loss, recent exercise, stress, medications, and lab method differences can shift results. The most reliable interpretation comes from patterns repeated over time.
How to Interpret Test Results
Small dense LDL results should be interpreted as part of a lipid and metabolic profile, not as an isolated number. The same result may carry different meaning in a lean endurance athlete, a person with type 2 diabetes, and a person with untreated hypothyroidism.
Some advanced lipid panels report LDL particle size in nanometers. Others report a subclass pattern, such as Pattern A or Pattern B. Others measure small dense LDL cholesterol concentration, written as sdLDL-C. NMR lipoprotein testing may report LDL particle number, small LDL particle number, HDL particle measures, and an insulin-resistance-related lipoprotein score.
A practical interpretation starts with five questions.
Are triglycerides elevated? Triglycerides above 150 mg/dL support a triglyceride-rich lipoprotein pattern. Above 500 mg/dL, pancreatitis risk becomes a major part of management, especially when levels are persistent.
Is HDL low? Low HDL often reflects metabolic stress, especially when paired with high triglycerides. Raising HDL by itself is usually not the main treatment target. Improving the underlying metabolic pattern is more important.
Is ApoB or LDL-P high? ApoB and LDL particle number estimate how many atherogenic particles are present. They often clarify risk when LDL-C and triglycerides disagree. An ApoB blood test is especially useful when triglycerides are high, metabolic syndrome is present, LDL-C seems lower than expected, or there is a family history of early heart disease.
Is glucose metabolism abnormal? Fasting glucose, A1c, fasting insulin, C-peptide, and sometimes an oral glucose tolerance test can show whether Pattern B is part of a broader insulin-resistance picture.
Are secondary causes present? Alcohol intake, hypothyroidism, kidney disease, pregnancy, menopause transition, certain medications, and high refined carbohydrate intake can all shift triglycerides and LDL subclasses.
A useful comparison is LDL-C versus ApoB. LDL-C tells you how much cholesterol is inside LDL particles. ApoB estimates the number of atherogenic particles, including LDL, VLDL remnants, IDL, and Lp(a). When triglycerides are high, particles may carry less cholesterol per particle. LDL-C can look “acceptable” while ApoB is higher than expected. This discordance is common in insulin resistance.
| Result pattern | Common meaning | Possible next step |
|---|---|---|
| High triglycerides + low HDL | Metabolic lipid pattern | Assess glucose, insulin resistance, waist size, liver enzymes, alcohol, and diet |
| Normal LDL-C + high ApoB | Many cholesterol-poor atherogenic particles | Consider particle-focused risk discussion and treatment intensity |
| High sdLDL + high triglycerides | Pattern B likely driven by triglyceride-rich lipoprotein metabolism | Target triglycerides, ApoB burden, and insulin resistance together |
| High LDL-C + Pattern A | Large LDL particles but cholesterol burden may still be high | Do not dismiss risk based only on larger particle size |
| Triglycerides above 500 mg/dL | Severe hypertriglyceridemia | Prompt clinician-guided plan to reduce pancreatitis risk |
An advanced small dense LDL test may help in selected cases, but it should not replace broader risk assessment. ApoB, non-HDL cholesterol, LDL-P, blood pressure, diabetes status, smoking, age, family history, kidney function, and prior cardiovascular events usually guide treatment decisions more directly.
Risk Beyond LDL Cholesterol
Small dense LDL is considered more atherogenic in several ways. These particles may enter the artery wall more easily, bind more strongly to artery-wall structures, remain in circulation longer, and become oxidized more readily. Oxidized and retained ApoB-containing particles are central to plaque formation.
Still, size alone does not tell the whole story. Cardiovascular risk depends heavily on the total number of atherogenic particles. A large LDL particle can still enter the artery wall. A small LDL particle can still carry ApoB. Remnant particles from VLDL and IDL can also contribute to plaque. Lp(a), another ApoB-containing particle, may add inherited risk even when triglycerides are normal.
This is why many lipid specialists focus on particle burden. ApoB, LDL-P, and non-HDL cholesterol often provide more actionable information than LDL size alone. The LDL-P versus ApoB comparison is useful because both markers aim to estimate the number of atherogenic particles, while LDL-C estimates cholesterol mass.
Pattern B may raise concern because it often marks a deeper metabolic problem. A person with Pattern B may also have high remnant cholesterol, high blood pressure, inflammatory liver fat, rising glucose, and visceral fat. These factors do not act in isolation. They amplify each other over years.
Risk can be underestimated when clinicians or patients look only at LDL-C. For example, LDL-C of 95 mg/dL may seem reassuring. If triglycerides are 260 mg/dL, HDL is 34 mg/dL, ApoB is 120 mg/dL, A1c is 6.1%, and blood pressure is high, the overall risk picture is very different. The LDL-C number is only one part of the story.
Risk can also be overinterpreted when small dense LDL is treated as a stand-alone danger sign. If triglycerides are low, HDL is healthy, ApoB is low, blood pressure is normal, glucose markers are normal, and there is no strong family history, a borderline particle-size finding may not change management much. The most useful question is whether the result identifies a treatable particle burden or metabolic pattern.
Common Causes and Contributing Factors
High triglycerides and Pattern B often come from more than one cause. Genetics may set the baseline, while diet, body composition, hormones, medications, sleep, and disease states push the pattern higher or lower.
Common contributors include:
- Insulin resistance and visceral fat: Abdominal fat is metabolically active and strongly linked with high VLDL production.
- High intake of refined carbohydrate or added sugar: Sugary drinks, desserts, white bread, refined grains, and frequent high-glycemic snacks can raise triglycerides in susceptible people.
- Alcohol: Alcohol can sharply raise triglycerides, especially in people who already have insulin resistance or fatty liver.
- Type 2 diabetes or prediabetes: Poor glucose control increases VLDL production and worsens triglyceride-rich lipoprotein metabolism.
- Fatty liver: Liver fat and high VLDL output often travel together.
- Hypothyroidism: Low thyroid hormone can worsen LDL-C, triglycerides, and particle patterns.
- Kidney disease: Reduced kidney function can affect triglycerides, HDL, and cardiovascular risk.
- Medications: Some beta blockers, thiazide diuretics, oral estrogen, steroids, retinoids, antipsychotics, HIV medicines, and immunosuppressants can raise triglycerides in some people.
- Pregnancy and hormonal transitions: Triglycerides normally rise during pregnancy and may shift during menopause.
- Genetic lipid disorders: Familial combined hyperlipidemia and other inherited patterns can cause high ApoB, high triglycerides, and small dense LDL.
Diet patterns deserve nuance. A very high refined-carbohydrate diet can raise triglycerides and worsen Pattern B. A very high saturated-fat diet can raise LDL-C and ApoB in many people, even if triglycerides fall. Some people lower triglycerides on a low-carbohydrate diet but see LDL-C or ApoB rise substantially. In that case, the pattern has improved in one way and worsened in another.
The full lipid response matters more than diet labels. A person changing their eating pattern should track triglycerides, HDL, LDL-C, non-HDL cholesterol, and ideally ApoB when risk is elevated. People with known cardiovascular disease, diabetes, kidney disease, or very high LDL-C need clinician-guided targets rather than trial-and-error interpretation.
A high triglyceride result should also prompt a review of recent meals, alcohol, illness, medication changes, weight change, and whether the test was fasting. Repeat testing often helps distinguish a temporary spike from a persistent pattern.
How to Lower Pattern B and Metabolic Lipid Risk
Lowering Pattern B risk usually means lowering triglyceride-rich particle production, improving insulin sensitivity, and reducing total ApoB-containing particle burden. The best plan depends on the starting pattern. Someone with triglycerides of 240 mg/dL and high insulin needs a different focus than someone with triglycerides of 90 mg/dL and very high LDL-C.
Food changes often make a visible difference within weeks to months. The most reliable first steps are reducing added sugars, replacing refined starches with higher-fiber foods, limiting alcohol, increasing protein quality, and choosing unsaturated fats more often than saturated or trans fats. For many people, fewer sugary drinks and less alcohol produce the largest triglyceride drop.
Useful food priorities include:
- Replace sugar-sweetened drinks with water, unsweetened tea, or other low-sugar options.
- Choose oats, beans, lentils, vegetables, berries, and whole grains instead of refined grains and sweets.
- Use olive oil, nuts, seeds, avocado, and fish in place of butter-heavy or processed-fat foods.
- Keep saturated fat moderate, especially if LDL-C or ApoB rises easily.
- Limit alcohol strongly when triglycerides are high; avoid it when levels are severely elevated unless a clinician says otherwise.
- Build meals around minimally processed foods that reduce post-meal glucose and triglyceride spikes.
Weight loss can lower triglycerides and improve insulin resistance when excess visceral fat is present. Even a 5% to 10% reduction in body weight can improve triglycerides, glucose, blood pressure, and liver fat for many people. The goal is not rapid weight loss at any cost. Sustainable changes that preserve muscle and improve metabolic health usually work better.
Exercise helps even without major weight loss. Aerobic activity improves triglyceride clearance, while resistance training helps muscle use glucose more effectively. A practical starting target is 150 minutes per week of moderate aerobic activity plus two weekly strength sessions, adjusted for fitness level and medical status. More activity may be needed for weight maintenance or larger triglyceride reductions.
Sleep and stress also matter. Short sleep, untreated sleep apnea, and chronic stress can worsen insulin resistance and appetite regulation. People with snoring, daytime sleepiness, resistant high blood pressure, or morning headaches should consider evaluation for sleep apnea.
Medication decisions depend on risk level. Statins remain a main treatment for reducing ApoB-containing particles and cardiovascular events in many higher-risk adults. Ezetimibe, PCSK9 inhibitors, bempedoic acid, fibrates, prescription omega-3 therapy, and other treatments may be used in specific situations. Severe triglycerides require special attention to pancreatitis prevention. Medication should be individualized, especially when diabetes, kidney disease, liver disease, pregnancy, or existing cardiovascular disease is present.
Remnant particles are also part of this pattern. When triglycerides are high, cholesterol carried in VLDL remnants and IDL can add risk beyond LDL-C. A remnant cholesterol and triglycerides discussion may be useful when standard LDL-C does not explain the overall risk pattern.
When to Follow Up With a Clinician
Follow-up is important when small dense LDL appears with other abnormal markers. Pattern B is most useful when it triggers a broader review of cardiometabolic risk rather than worry about particle size alone.
Schedule a clinician review if results show:
- Triglycerides persistently 150 mg/dL or higher, especially with low HDL
- Triglycerides 500 mg/dL or higher on any test
- ApoB, LDL-P, or non-HDL cholesterol above the target range for your risk level
- A1c, fasting glucose, fasting insulin, or HOMA-IR suggesting insulin resistance
- High blood pressure, fatty liver, kidney disease, or metabolic syndrome
- A strong family history of early heart attack, stroke, or very high cholesterol
- Chest pressure, shortness of breath with exertion, sudden weakness, or other possible cardiovascular symptoms
Urgent care is needed for symptoms that may suggest heart attack or stroke, such as chest pain, pressure spreading to the arm or jaw, sudden shortness of breath, one-sided weakness, facial droop, trouble speaking, fainting, or severe unexplained sweating. Very high triglycerides with severe upper abdominal pain, nausea, vomiting, or fever also needs prompt medical evaluation because pancreatitis can be dangerous.
For non-urgent follow-up, repeat testing is often done after 4 to 12 weeks of lifestyle changes, medication adjustment, improved glucose control, or alcohol reduction. A fasting repeat lipid panel can clarify triglycerides, calculated LDL-C, and non-HDL cholesterol. ApoB can help show whether particle burden improved. Glucose and insulin markers can show whether the metabolic driver is improving.
A reasonable follow-up panel may include a fasting lipid panel, ApoB, A1c, fasting glucose, liver enzymes, kidney function, thyroid-stimulating hormone, and urine albumin-to-creatinine ratio when diabetes or kidney risk is present. Advanced particle testing may be considered if it will change management, but it is not always necessary.
Small dense LDL and triglycerides should be treated as a pattern with causes. The most productive approach is to lower triglyceride-rich lipoprotein excess, improve insulin sensitivity, reduce ApoB-containing particle burden, and manage the person’s full cardiovascular risk profile over time.
References
- Clinical significance of small dense low-density lipoprotein cholesterol measurement in type 2 diabetes 2025 (Review)
- The Role of Atherogenic Small, Dense LDL 2022 (Review)
- Triglyceride-rich lipoproteins and their remnants: metabolic insights, role in atherosclerotic cardiovascular disease, and emerging therapeutic strategies-a consensus statement from the European Atherosclerosis Society 2021 (Consensus Statement)
- 2021 ACC Expert Consensus Decision Pathway on the Management of ASCVD Risk Reduction in Patients With Persistent Hypertriglyceridemia 2021 (Guideline)
- Role of apolipoprotein B in the clinical management of cardiovascular risk in adults: An Expert Clinical Consensus from the National Lipid Association 2024 (Position Statement)
- The Effect of Diet on Cardiovascular Disease and Lipid and Lipoprotein Levels 2024 (Review)
Disclaimer
Small dense LDL, triglycerides, ApoB, and insulin-resistance markers should be interpreted with your medical history, medications, family history, and overall cardiovascular risk. Do not start, stop, or change lipid, diabetes, thyroid, or blood pressure medication based only on one lab result. Seek urgent medical care for possible heart attack, stroke, pancreatitis symptoms, or very high triglycerides with severe abdominal pain.