
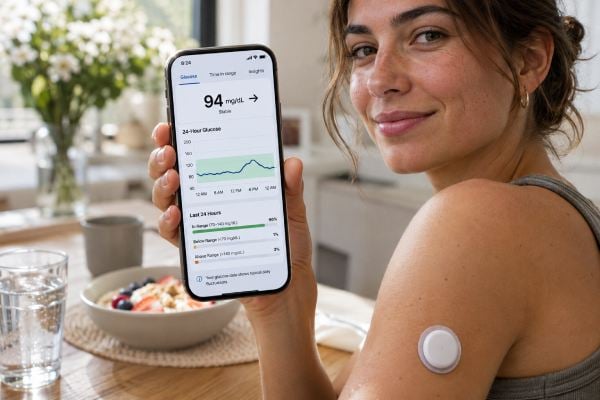
For people without diabetes, there is no single officially accepted continuous glucose monitor “time in range” target. The familiar diabetes benchmark of spending more than 70% of the day between 70 and 180 mg/dL was designed for managing insulin-treated diabetes, not as a definition of normal physiology in healthy adults. Recent studies suggest that non-diabetic adults commonly spend roughly 87% to over 90% of their time between 70 and 140 mg/dL, though results vary by age, population, sensor technology, and how “normal glucose” was defined. Brief readings above 140 mg/dL—and occasionally above 180 mg/dL—can occur after meals without indicating prediabetes or diabetes.
CGMs also have inherent measurement error, lag behind blood glucose, and can produce compression lows or exaggerated peaks. The most useful approach is to look at repeated patterns over several days and use laboratory tests such as fasting glucose, A1C, or an oral glucose tolerance test for diagnosis. A CGM can provide valuable context, but it should not turn every post-meal rise into a medical problem.
Table of Contents
- What time in range means
- What studies show in people without diabetes
- Why 70–180 mg/dL is not a “normal” range
- How to interpret post-meal spikes
- CGM accuracy, lag, and false readings
- When CGM data deserves follow-up
What time in range means
Time in range is the percentage of time a glucose sensor records values inside a chosen glucose interval. If your range is set to 70–140 mg/dL and your CGM shows 90% time in range, that means about 21 hours and 36 minutes of a 24-hour day fell within that interval.
The concept originated in diabetes care, where CGM metrics reveal patterns that A1C cannot. Two people can have the same A1C but very different numbers of highs, lows, and daily swings. For many adults with diabetes, international guidance commonly uses 70–180 mg/dL as the main target range, aiming for more than 70% of time there, with separate targets for time below and above range.
That diabetes framework should not be copied directly to people without diabetes. A range chosen to be safe and practical for insulin-treated diabetes is intentionally broad. Someone without diabetes will usually spend much more than 70% of the day between 70 and 180 mg/dL, so meeting that target says little about whether their glucose regulation is normal.
For people without diabetes, researchers often examine a tighter range such as 70–140 mg/dL. You may see this called “time in tight range.” It is useful for describing physiology, but it is not yet a universally standardized diagnostic target for healthy adults.
Units can add confusion. Common equivalents are:
- 70 mg/dL is about 3.9 mmol/L;
- 100 mg/dL is about 5.6 mmol/L;
- 140 mg/dL is about 7.8 mmol/L;
- 180 mg/dL is about 10.0 mmol/L.
CGMs also generate metrics such as average glucose, glucose management indicator, coefficient of variation, and time above or below thresholds. None should be interpreted in isolation. If you are new to sensors, the broader guide to CGM use in people without diabetes can help separate useful feedback from unnecessary monitoring.
What studies show in people without diabetes
Recent research provides better reference data, but the numbers are not identical across studies. That variation is expected because studies enroll different ages, ethnic groups, body sizes, diets, and levels of metabolic health. They also use different CGM devices and definitions of “without diabetes.”
A large community-based cohort published in 2024 examined adults without diabetes and divided participants into normoglycemia and prediabetes. Among 560 people with normoglycemia, average time between 70 and 140 mg/dL was about 87%. They spent about 12% of the day above 140 mg/dL, and brief time above 180 mg/dL was not zero. Participants with prediabetes spent less time in the 70–140 mg/dL range.
A much larger 2026 analysis of more than 8,000 adults without diabetes found a median around 93% of time in the 70–140 mg/dL range and roughly 95% in 70–180 mg/dL. The exact values differed across metabolic subgroups. Taken together, these studies show two important things: healthy glucose is tightly regulated most of the day, and occasional excursions outside a tight range can still occur.
Other datasets involving thousands of non-diabetic CGM users have also shown substantial person-to-person variation. Age, meal composition, timing, sleep, exercise, and individual physiology all contribute. That is why one person’s social-media screenshot should not become your target.
A reasonable practical interpretation is that spending the large majority of the day between 70 and 140 mg/dL is common in people with normal glucose regulation. But there is not enough evidence to declare that 90%, 92%, or 95% is a universal clinical cutoff separating health from disease.
If you want to understand day-to-day variation rather than one threshold, normal glucose variability and A1C provides a useful framework. Reference ranges describe populations; they do not replace diagnostic criteria.
Why 70–180 mg/dL is not a “normal” range
The 70–180 mg/dL range is valuable in diabetes management because it balances tight control with safety. For a person taking insulin, avoiding severe hypoglycemia is critical, and post-meal glucose may frequently exceed levels seen in people without diabetes. A target that is achievable and linked with lower complication risk is more useful than demanding non-diabetic glucose all day.
For a healthy person, however, 180 mg/dL is a relatively high threshold. Spending 98% of the day below 180 mg/dL may sound excellent, but it can hide repeated rises to 160–175 mg/dL after meals. Whether those rises matter depends on the broader pattern and laboratory measures.
This is why researchers interested in normoglycemia often use 70–140 mg/dL. Even that range requires context. Glucose is dynamic. After a carbohydrate-containing meal, it should rise. Muscles and the liver then clear glucose under the influence of insulin and other signals. A temporary value of 145 mg/dL is not automatically abnormal in the same way that a persistent fasting value of 145 mg/dL would be.
Do not turn “time in tight range” into a new perfection target. Aiming for 100% between 70 and 140 mg/dL can encourage unnecessary food restriction, especially because sensor error alone can push readings across a cutoff. It may also penalize nutritious foods such as fruit, legumes, or whole grains because they create a normal post-meal rise.
The more useful question is whether your pattern is consistent with good regulation: mostly stable overnight glucose, modest meal rises that return toward baseline, limited prolonged hyperglycemia, and laboratory values in the normal range.
If you are trying to interpret a high A1C or fasting glucose, use the article on A1C ranges for normal glucose, prediabetes, and diabetes. Diagnostic tests have validated thresholds; consumer CGM “normal ranges” do not yet have the same status.
How to interpret post-meal spikes
A post-meal spike is simply a rise in glucose after eating. The word “spike” often sounds dangerous, but not every sharp-looking CGM curve represents harmful hyperglycemia.
Start with the meal. Refined carbohydrate eaten by itself—such as sweetened cereal, white bread, juice, or candy—usually raises glucose faster than a mixed meal containing protein, fiber, and fat. A large portion also matters. A healthy person can therefore produce a higher peak after a large bowl of white rice than after fish, vegetables, and a smaller rice portion.
Next, look at duration. A brief rise that returns toward baseline is different from glucose that remains elevated for several hours. Repeated prolonged elevations across many meals are more concerning than an isolated short peak.
Then consider reproducibility. If the same breakfast causes a high reading three different times under similar conditions, that pattern deserves more attention than one unusual day after poor sleep or illness. The idea of personalized blood sugar responses to foods is useful here because people can respond differently to the same carbohydrate load.
Avoid using one universal peak cutoff as a pass/fail test. A value above 140 mg/dL can occur in healthy people, and even brief excursions above 180 mg/dL have been documented in normoglycemic cohorts. That does not mean frequent large excursions should be ignored. It means the context, frequency, duration, and accuracy of the sensor all matter.
A short walk after a meal can lower the curve by increasing muscular glucose uptake. Eating vegetables or protein before a large carbohydrate portion can also reduce the early rise. These are reasonable experiments if you want to improve post-meal patterns, but you do not need to engineer a perfectly flat response to every meal.
If a food repeatedly produces a large or prolonged rise, adjust the portion or pair it with protein and fiber before deciding the food is “bad.” Metabolic health is built from overall dietary patterns, not individual CGM peaks.
CGM accuracy, lag, and false readings
A CGM does not directly measure glucose in a vein or fingertip. A small sensor estimates glucose in interstitial fluid, the fluid between cells. Because glucose moves from blood into interstitial fluid, CGM values can lag behind blood glucose by several minutes, especially when glucose is changing quickly.
That lag can make the peak appear later than it really occurred. It can also create disagreement with a finger-stick meter during exercise, after a high-carbohydrate meal, or while glucose is falling rapidly.
Accuracy is good enough to make CGMs extremely useful, but it is not perfect. Recent research in adults without diabetes has highlighted meaningful bias. One randomized crossover trial found that a CGM overestimated post-meal glycemia compared with capillary measurements, including overestimating time above a 140 mg/dL threshold. A 2026 study of over-the-counter CGMs in young adults without diabetes found overall error around the low-teens percentage range and an average lag of several minutes, with performance worsening during rapid glucose changes.
Compression lows are another common artifact. Sleeping or leaning directly on the sensor can reduce local interstitial flow and produce a falsely low reading. If your graph suddenly drops overnight while you feel fine and then rebounds quickly after you change position, compression is a possibility.
First-day sensors can also behave differently, and dehydration, sensor placement, temperature, and individual tissue characteristics may affect readings. Different CGM brands use different algorithms, so two sensors can show slightly different curves.
If a reading is surprising or does not match symptoms, confirm it with a reliable blood glucose meter when clinically appropriate. The guide to CGM accuracy, lag, and compression lows explains the most common reasons sensors disagree with blood glucose.
This measurement uncertainty is why small threshold crossings should not drive major diet changes. A sensor reading of 142 mg/dL instead of 138 mg/dL is not a meaningful metabolic verdict.
When CGM data deserves follow-up
CGM data is most useful when it identifies a repeated pattern that can be checked with established tests. If you repeatedly spend substantial time at unexpectedly high glucose levels, have elevated fasting readings, or see prolonged post-meal values that do not return toward baseline, discuss the pattern with a healthcare professional.
Symptoms can strengthen the reason to test. Excessive thirst, frequent urination, unexplained weight loss, blurred vision, recurrent infections, or unusual fatigue can occur with significant hyperglycemia. On the low side, recurrent shakiness, sweating, confusion, or fainting with confirmed low glucose also deserves evaluation.
The next step is usually laboratory testing rather than more CGM interpretation. Common diagnostic tests include fasting plasma glucose, A1C, and the two-hour 75-gram oral glucose tolerance test. A1C estimates average exposure over roughly two to three months, while fasting glucose and an OGTT capture different aspects of glucose regulation.
Do not use a CGM’s glucose management indicator as a substitute for laboratory A1C in someone without diabetes. The estimate is derived from sensor averages and may differ from measured A1C because of red blood cell biology, sensor bias, and the limited duration of wear.
If your laboratory tests are normal and you feel well, occasional post-meal excursions generally need context rather than alarm. A systematic review of CGM use in non-diabetic populations found that the clinical benefits of CGM in healthy normoglycemic adults remain uncertain. More data is not automatically better if it leads to fear, needless restriction, or constant checking.
Use CGM information to ask practical questions: Which breakfasts leave me steady and satisfied? Does a short walk improve a reproducible high pattern? Does poor sleep raise my morning glucose? These questions turn the sensor into a behavior tool rather than a scorecard.
For most people without diabetes, the bottom line is this: 70–140 mg/dL is a useful research range, not a rigid daily target. Spending roughly nine-tenths or more of the day there is common in normoglycemic cohorts, but individual variation and device error are real. Diagnose with validated laboratory tests and use CGM trends as supporting information.
Age is another reason not to compare yourself with a single online benchmark. Some studies find modestly higher average glucose or more time above a tight range in older adults even when standard laboratory tests remain normal. Meal patterns, activity, body composition, and sleep can also shift with age. A reference value should therefore be interpreted as a population description, not a personal grade.
Nighttime data can be particularly informative because it removes the immediate effect of meals. Glucose that is generally steady overnight and returns toward baseline after dinner is reassuring, while repeatedly elevated overnight or fasting values deserve more attention. At the same time, overnight low alarms are especially vulnerable to compression artifacts, so confirm surprising readings rather than assuming true hypoglycemia.
Sensor wear duration matters too. Three unusually stressful days are not the same as two representative weeks. If you are using a CGM for learning, include ordinary workdays and weekends rather than starting during travel, illness, or an unusually restrictive diet. The purpose is to understand your normal pattern.
Finally, remember that a tighter range is not always a better health outcome by itself. You can make a CGM graph flatter by avoiding most carbohydrate, but that does not automatically mean the resulting diet has better fiber intake, micronutrient quality, cardiovascular effects, or long-term adherence. Evaluate glucose alongside blood pressure, lipids, activity, sleep, weight trajectory when relevant, and overall diet quality. CGM data is one layer of metabolic information, not the whole picture.
It can be useful to summarize a CGM experiment before removing the sensor. Write down two or three patterns that were repeatable, one behavior that improved the curve, and any reading that needs medical confirmation. This prevents the experience from becoming a collection of screenshots without a conclusion. If the sensor mostly showed normal patterns, that is also useful information. You do not need continuous monitoring indefinitely to benefit from a short learning period. For many people without diabetes, repeating standard laboratory screening at the interval recommended by a clinician is more informative than continuously pursuing a higher time-in-range percentage.
A useful CGM review should therefore end with fewer questions, not more. Keep the patterns that are reproducible, confirm anything medically important with standard testing, and ignore tiny day-to-day differences that are within normal biological and sensor variation.
References
- Defining Continuous Glucose Monitor Time in Range in a Large, Community-Based Cohort Without Diabetes. 2024 (Observational Study)
- Investigating the Spectrum of Normoglycemia: Time in Glycemic Ranges and Their Association With Metabolic Outcomes in Individuals Without Diabetes. 2026 (Observational Study)
- CGMap: Characterizing continuous glucose monitor data in thousands of non-diabetic individuals 2023 (Observational Study)
- Continuous glucose monitoring in non-diabetic populations: a systematic review of observational and interventional studies with meta-analysis. 2026 (Systematic Review)
- Continuous glucose monitor overestimates glycemia, with the magnitude of bias varying by postprandial test and individual – a randomized crossover trial 2025 (RCT)
- Agreement of Over-the-Counter Continuous Glucose Monitors With Capillary-Meter Glucose in Young Adults Without Diabetes. 2026 (Validation Study)
Disclaimer
This article is for general education and is not a diagnostic standard for diabetes or hypoglycemia. Consumer CGM readings can differ from laboratory or finger-stick glucose, especially during rapid changes. If you have repeated abnormal readings, symptoms, or concerns about diabetes risk, ask a healthcare professional about validated laboratory testing.