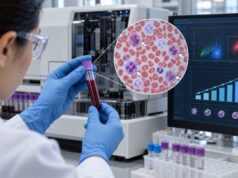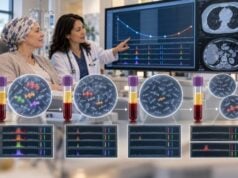
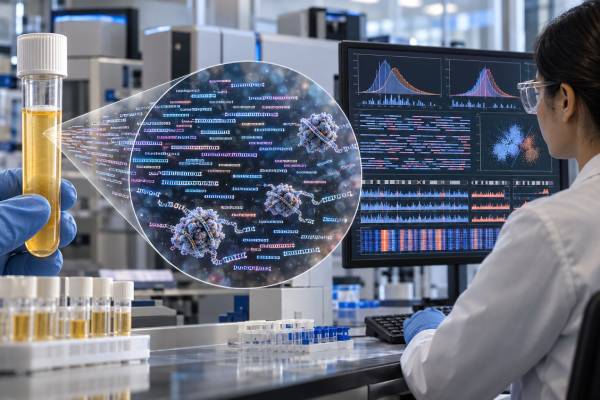
A fragmentomics cancer blood test looks at the physical patterns of cell-free DNA fragments in plasma rather than relying only on specific tumor mutations. When cells die and release DNA into the bloodstream, the DNA is cut into fragments in ways influenced by chromatin structure, nucleosomes, enzymes, tissue of origin, and disease biology. Cancer can alter those patterns. Researchers can therefore study fragment length, fragment ends, genomic coverage, nucleosome footprints, and related features to build blood-based cancer classifiers.
Fragmentomics is one of the most active areas of liquid-biopsy research because it can extract information from millions of cfDNA fragments even when the amount of tumor DNA is low. The tradeoff is that these tests are complex and often depend on machine-learning models. There is no universal fragmentomics “normal range,” and strong results in case-control studies do not automatically translate into effective population screening. Prospective studies in asymptomatic people, standardized workflows, and evidence that testing improves outcomes are essential before broad clinical use.
- Fragmentomics measures cfDNA fragmentation patterns—such as fragment size, end motifs, genomic positions, and nucleosome-related signals—rather than only searching for mutations.
- There is no universal normal fragmentomics score because each assay combines different features and uses its own validated classifier and cutoff.
- A positive cancer classifier is a risk signal, not a cancer diagnosis; imaging, tissue evaluation, or other established testing is needed for confirmation.
- A negative result cannot rule out cancer, especially when a small or early tumor contributes very little abnormal cfDNA to blood.
- Fragmentomics is promising for early and multi-cancer detection, but most approaches remain investigational and require prospective validation in intended screening populations.
Table of Contents
- What cfDNA Fragmentomics Is
- Why Cancer Changes DNA Fragment Patterns
- Fragmentomic Features a Test Can Measure
- How Fragmentomics Blood Testing Works
- What Fragmentomics Results Mean
- Evidence for Early and Multi-Cancer Detection
- Limitations and Next Steps for Clinical Use
What cfDNA Fragmentomics Is
Fragmentomics is the study of patterns created when cell-free DNA is broken into pieces and released into body fluids. In cancer testing, the most common specimen is plasma. Most plasma cfDNA comes from normal cells, especially blood-forming cells, while a variable minority can come from tumor cells. That tumor-derived portion is called circulating tumor DNA, or ctDNA.
Traditional ctDNA assays often ask a sequence-focused question: is a mutation such as EGFR, KRAS, BRAF, or PIK3CA present? Fragmentomics asks a different set of questions: How long are the DNA pieces? Where in the genome do they start and stop? Which short sequences appear at fragment ends? Does the coverage pattern imply that certain chromatin regions were open or closed in the cell that released the DNA?
Those features can carry information even when a tumor does not have a convenient recurrent mutation. This makes fragmentomics a potential complement to a ctDNA mutation panel. Mutation testing seeks discrete sequence changes, while fragmentomics uses a large number of distributed physical and genomic signals.
The concept also differs from simply measuring the total amount of cfDNA. A cell-free DNA cancer test may use mutations, methylation, copy-number changes, fragment patterns, or combinations of these. Fragmentomics refers specifically to information encoded in how cfDNA is fragmented and distributed.
Because these signals are high-dimensional, many modern fragmentomic assays use statistical models or machine learning to combine thousands to millions of measurements into a cancer probability or classification score. The model—not one individual fragment—is usually the diagnostic unit.
Why Cancer Changes DNA Fragment Patterns
DNA inside a living cell is wrapped around proteins called histones, forming nucleosomes. Chromatin is not organized the same way in every tissue or cell state. Genes that are active tend to sit in a different chromatin environment from genes that are silent. When cells die, enzymes cut DNA around these structures, leaving a non-random pattern in the fragments released into circulation.
Normal plasma cfDNA commonly shows a strong peak around the length of DNA protected by a nucleosome plus linker DNA, roughly in the 160–170 base-pair range. Tumor-derived cfDNA often has a higher proportion of shorter fragments, although the exact pattern varies by cancer, disease burden, specimen processing, and analytical method. Cancer can also change where fragmentation occurs across the genome.
Several biological factors contribute:
- Abnormal chromatin organization: Cancer cells alter gene regulation and nucleosome positioning, changing which genomic regions are protected during fragmentation.
- Different cell-death pathways: Apoptosis, necrosis, immune-mediated killing, and other processes can leave different DNA-fragment signatures.
- Altered nuclease activity: Enzymes that cut DNA can be expressed or regulated differently in cancer and surrounding tissues.
- Copy-number changes: Gains and losses of chromosome regions alter the number of fragments mapped to those regions.
- Tissue of origin: Liver, lung, immune, epithelial, and other cells have distinct chromatin landscapes that can influence fragment patterns.
This biology gives fragmentomics a potentially rich signal, but it also creates confounding. Inflammation, tissue injury, exercise, pregnancy, organ disease, and other non-cancer conditions can change the cells contributing cfDNA. A classifier therefore has to distinguish a cancer-associated pattern from normal biological variation rather than merely detect that cfDNA has changed.
The strongest approaches often combine many weak signals. One fragment being short is not meaningful by itself. Millions of fragments showing coordinated shifts in size, position, and ends may create a detectable cancer pattern.
Fragmentomic Features a Test Can Measure
Fragmentomics is not a single laboratory measurement. Different research platforms emphasize different features, and some combine several of them.
| Feature | What is measured | Potential cancer information |
|---|---|---|
| Fragment length | Size distribution of cfDNA pieces | Tumor-derived DNA often shows altered size profiles |
| End motifs | Short DNA sequences at fragment ends | May reflect nuclease activity and cell-of-origin biology |
| Preferred ends | Genomic locations where fragments start or stop more often | Can reveal disease-associated cleavage patterns |
| Genome-wide coverage | Relative fragment counts across genomic regions | Can reflect copy-number changes and chromatin structure |
| Nucleosome footprints | Coverage patterns around nucleosome-protected regions | May indicate gene activity and tissue of origin |
| Jagged or single-stranded ends | Irregular fragment-end structures | May add information about DNA processing and cell death |
Some assays also integrate fragmentomic signals with mutations, methylation, or protein biomarkers. This can improve classification because the data types answer different biological questions. Methylation can identify epigenetic patterns, mutation testing can reveal specific tumor genotypes, and fragmentomics can capture genome-wide physical organization.
A multi-feature model may produce one cancer score even though thousands of underlying variables contributed to it. That is why a patient usually cannot interpret the result by asking whether one fragment length is “high” or “low.” The relevant cutoff belongs to the validated model as a whole.
Fragmentomics can also be used for more than detection. Researchers are evaluating whether serial patterns can estimate treatment response, minimal residual disease, recurrence risk, or tumor tissue of origin. Those applications are at different stages of maturity and should not be assumed to have the same accuracy as a model developed for initial cancer detection.
How Fragmentomics Blood Testing Works
A typical research workflow begins with a blood draw into a tube designed to preserve cfDNA. Plasma is separated promptly or under validated stabilization conditions so that white blood cells do not break down and release large amounts of genomic DNA. Excess cellular DNA can dilute the fragmentomic signal and distort size distributions.
The laboratory then extracts cfDNA and prepares a sequencing library. Many fragmentomic methods use low-pass or shallow whole-genome sequencing because useful patterns are distributed across the genome and may not require extremely deep sequencing at every base. Other approaches enrich selected regions or use specialized library methods to preserve information about fragment ends or methylation.
The computational pipeline is central to the test. Common steps include:
- mapping millions of cfDNA fragments to the reference genome;
- measuring length and end characteristics;
- calculating coverage or nucleosome-associated features across genomic windows;
- correcting technical biases such as GC content and sequencing depth;
- combining selected features in a pre-trained statistical or machine-learning classifier; and
- generating a score, cancer-signal call, or predicted tissue of origin.
A well-designed classifier must be locked before independent validation. If researchers repeatedly adjust the algorithm after seeing the test cohort, reported performance can look better than it will in new patients. Independent validation protects against this type of overfitting.
Pre-analytical consistency is equally important. Tube type, time to plasma separation, centrifugation, storage, freeze-thaw cycles, extraction kit, sequencing platform, and library preparation can all influence fragment patterns. A model trained under one workflow may not retain the same performance after laboratory changes unless the new process is bridged and validated.
This makes fragmentomics different from a conventional lab value measured directly against a stable reference interval. The final result often reflects the complete chain from specimen handling through software version, so analytical validation must cover both laboratory and computational components.
What Fragmentomics Results Mean
A fragmentomics report may return a numerical risk score, a binary “signal detected/not detected” result, a predicted cancer type, or several probabilities. There is no universal fragmentomics normal range. A score of 0.7 on one platform cannot be compared with 0.7 on another because the features, model, training cohort, and calibration may be completely different.
A positive result usually means the sample’s cfDNA fragmentation pattern crossed a prespecified threshold associated with cancer in validation data. It does not prove that a malignant tumor exists. Diagnostic confirmation requires established methods chosen according to the suspected organ and clinical context.
A negative result means the classifier did not detect enough cancer-associated signal to cross its threshold. It does not mean “no cancer.” Early tumors may contribute extremely little abnormal cfDNA, and some tumor types shed less DNA than others. A person with symptoms, abnormal imaging, or another strong cancer concern should not delay diagnostic evaluation because of a negative fragmentomics test.
The meaning of a positive result also depends heavily on prevalence. In a case-control study where half the participants have cancer, positive predictive value can appear much higher than it will in a general screening population where cancer is uncommon. Specificity therefore becomes especially important for screening: even a small false-positive percentage can lead to many follow-up scans or procedures when millions of healthy people are tested.
Performance should be judged using at least four measures:
- Sensitivity: how often the test detects cancer when cancer is truly present.
- Specificity: how often it stays negative when cancer is absent.
- Positive predictive value: how often a positive result is confirmed as cancer in the tested population.
- Negative predictive value: how often a negative result corresponds to no cancer during appropriate follow-up.
These numbers should come from a population similar to the people who will actually receive the test, not just from carefully selected cancer cases and healthy controls.
Evidence for Early and Multi-Cancer Detection
Fragmentomics is attractive for early detection because it may capture many distributed signals when the absolute amount of ctDNA is too low for reliable mutation detection. Recent reviews describe rapidly expanding methods that combine fragment length, end motifs, nucleosome footprints, copy-number patterns, methylation-related features, and artificial intelligence.
But study design strongly affects apparent performance. A 2025 multidimensional cfDNA fragmentomics study illustrates the difference. In an independent validation cohort containing known cancer cases and non-cancer controls, the reported overall sensitivity was 87.4% and specificity was 97.8%. In preliminary prospective data from 3,724 asymptomatic participants, sensitivity was 53.5% and specificity was 98.1%. The lower sensitivity in the screening-like setting does not mean the technology failed; it shows why performance must be measured in the intended-use population.
Early-stage detection is particularly difficult. Stage I tumors are smaller and often shed less DNA, so sensitivity generally falls as stage decreases. A test that detects most stage III–IV cancers but misses many stage I cancers may still be biologically impressive, yet it may not deliver the hoped-for benefit of shifting diagnosis earlier.
Fragmentomics is also being studied as one component of multi-cancer early detection testing. A single blood sample could, in theory, identify a shared cancer signal and estimate tissue of origin. The challenge is not only detecting a signal but creating a safe diagnostic pathway after it. A positive result without a clear origin can trigger broad imaging and invasive workups.
The current evidence base contains promising retrospective, case-control, and prospective studies, but no single fragmentomics platform should be generalized to the entire field. Each classifier requires its own analytical and clinical validation. Systematic reviews of machine-learning cfDNA studies also show substantial variation in cancer types, feature sets, study populations, and validation methods, which limits simple comparison of headline accuracy numbers.
For screening, the ultimate question is not just whether a classifier can separate stored cancer samples from controls. It is whether testing asymptomatic people leads to earlier clinically meaningful diagnoses and better outcomes while keeping false-positive harms acceptable.
Limitations and Next Steps for Clinical Use
Several obstacles must be solved before fragmentomics becomes routine across cancer screening and monitoring.
Standardization is a major issue. Fragment length and end measurements are sensitive to blood handling, DNA extraction, library preparation, sequencing, and bioinformatics. Laboratories need reference materials, reproducibility studies, version control, and clear quality thresholds.
Population diversity matters. A model trained mainly in one age group, ancestry, hospital system, or disease spectrum may perform differently elsewhere. Common chronic conditions can change cfDNA composition, so validation cohorts should include realistic comorbidities rather than only unusually healthy controls.
Machine-learning transparency and drift matter. Updating a classifier can improve performance, but it can also change what a score means. Clinical assays need locked, traceable versions and evidence that software changes preserve or improve validated performance.
Screening harms must be measured. Researchers need to count downstream imaging, biopsies, incidental findings, anxiety, overdiagnosis, false reassurance, cost, and time to diagnostic resolution—not just sensitivity and specificity. A screening technology can be analytically impressive yet produce little net benefit if the follow-up cascade is burdensome.
Clinical utility must be demonstrated. The strongest evidence would show that testing leads to outcomes that matter, such as fewer late-stage diagnoses or cancer deaths, rather than only earlier test positivity. This is the same evidence standard that applies to other emerging blood-based screening approaches.
For people who already have cancer, fragmentomics may ultimately complement a circulating tumor DNA test for response or recurrence monitoring. The combination could be useful when no trackable mutation is present. However, a research signal should not be treated as established minimal residual disease unless that specific assay and clinical use have been validated.
When evaluating a fragmentomics test, ask what population it was validated in, whether the study was prospective, which stages were represented, how false positives were resolved, whether the algorithm was independently locked, and what action follows a positive result. These questions are more informative than a single advertised accuracy percentage.
Fragmentomics has expanded the idea of what DNA in blood can reveal. The fragments are not simply debris; their physical patterns reflect the cellular processes that created them. Turning those patterns into reliable cancer screening or monitoring tools is scientifically plausible and increasingly well supported, but clinical value will depend on rigorous prospective evidence rather than laboratory performance alone.
References
- Integrating liquid biopsies and artificial intelligence for early cancer detection: A systematic review and meta-analysis 2026 (Systematic Review and Meta-analysis)
- Cell-free DNA fragmentomics in cancer 2025 (Review)
- Genomic and fragmentomic landscapes of cell-free DNA for early cancer detection 2025 (Review)
- Early detection of multiple cancer types using multidimensional cell-free DNA fragmentomics 2025
- Cell-free DNA fragmentomics: a universal framework for early cancer detection and monitoring 2025 (Review)
- Cancer Screening Overview (PDQ®) 2023
Disclaimer
Fragmentomics-based cancer assays are an evolving technology, and many proposed screening and monitoring uses remain investigational. A positive fragmentomic cancer signal is not a diagnosis, and a negative result should not delay evaluation of symptoms, abnormal imaging, or other cancer concerns. Discuss any commercial or research result with a qualified clinician who can place it in the context of established screening and diagnostic care.