
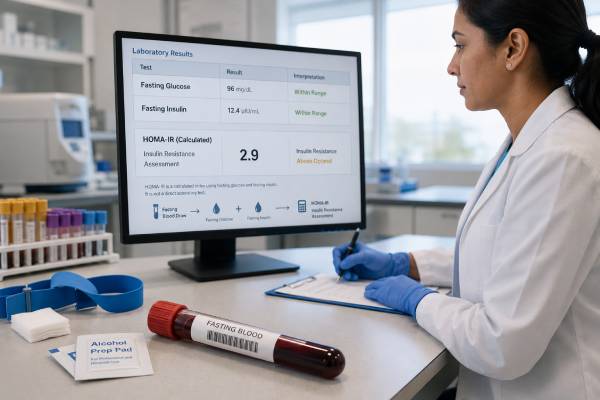
HOMA-IR is a calculated estimate of insulin resistance based on fasting glucose and fasting insulin measured from the same blood draw. A higher score usually means the body needs more insulin to keep fasting glucose controlled, but HOMA-IR is not a universal diagnostic test and has no single cutoff that fits every laboratory, age group, ethnicity, pregnancy state, or medical condition. The original HOMA1 formula is simple enough to calculate by hand, while HOMA2 uses a computer model that better accounts for nonlinear glucose-insulin physiology. Both are most useful for population studies, trend monitoring under consistent conditions, and selected metabolic evaluations. They are less reliable when a person uses insulin, has marked hyperglycemia, has poor beta-cell function, is acutely ill, or did not fast correctly. A HOMA-IR result should be interpreted alongside A1C, fasting glucose, lipids, blood pressure, waist size, liver health, medications, and overall cardiometabolic risk.
- HOMA-IR is calculated from fasting insulin and fasting glucose; it is not a separately measured hormone.
- The HOMA1 formula is insulin × glucose ÷ 405 when glucose is in mg/dL, or insulin × glucose ÷ 22.5 when glucose is in mmol/L.
- Higher scores generally suggest greater insulin resistance, but no universal “normal” cutoff exists.
- Insulin assay differences can shift the score, so results from different laboratories may not be directly comparable.
- HOMA-IR does not diagnose diabetes; diabetes is diagnosed with validated glucose or A1C criteria.
Table of Contents
- What HOMA-IR Measures
- How HOMA-IR Is Calculated
- Preparing for the Test
- Normal Range and Cutoffs
- High HOMA-IR Results
- Low HOMA-IR Results
- Limitations and Common Errors
- Using Results and Planning Follow-Up
What HOMA-IR Measures
HOMA stands for homeostatic model assessment. The model estimates the balance between glucose released mainly by the liver and insulin secreted by pancreatic beta cells during a fasting steady state. HOMA-IR is the version used to estimate insulin resistance. Related model outputs can estimate beta-cell function, often labeled HOMA-%B, and insulin sensitivity, often labeled HOMA-%S.
Insulin resistance means muscle, liver, fat, and other tissues respond less effectively to insulin. Early in the process, the pancreas can compensate by producing more insulin. Fasting glucose may remain within the laboratory range while fasting insulin rises. HOMA-IR combines those two signals into one index.
The score reflects fasting physiology more than the body’s full response to meals or exercise. It is influenced heavily by hepatic insulin resistance because fasting glucose depends substantially on how well insulin suppresses liver glucose production. It provides less direct information about glucose uptake by skeletal muscle after a meal.
HOMA-IR is widely used because it is inexpensive and practical compared with research reference methods. The hyperinsulinemic-euglycemic clamp directly measures the amount of glucose needed to maintain a target glucose level during a controlled insulin infusion, but it is time-intensive, technically demanding, and rarely used in ordinary practice. Frequently sampled intravenous glucose testing and oral tolerance-derived indices are other options, each with distinct assumptions.
A HOMA-IR score is therefore an estimate, not a direct measurement. It can be useful when:
- Comparing groups in metabolic research
- Following fasting insulin resistance over time under similar conditions
- Adding context to obesity, metabolic syndrome, fatty liver, polycystic ovary syndrome, or prediabetes evaluation
- Assessing whether high fasting insulin accompanies normal or mildly elevated fasting glucose
- Monitoring a structured lifestyle or weight-management intervention when the same laboratory method is used
It is usually unnecessary for diagnosing diabetes. Standard tests—A1C, fasting plasma glucose, random plasma glucose in a symptomatic person, or a two-hour oral glucose tolerance value—have validated diagnostic thresholds. A normal HOMA-IR does not rule out diabetes, and a high HOMA-IR does not prove it.
How HOMA-IR Is Calculated
The original HOMA1-IR formula requires fasting insulin and fasting glucose obtained at the same time.
When glucose is reported in mg/dL:
HOMA-IR = fasting insulin (µIU/mL) × fasting glucose (mg/dL) ÷ 405
When glucose is reported in mmol/L:
HOMA-IR = fasting insulin (µIU/mL) × fasting glucose (mmol/L) ÷ 22.5
Because 1 µIU/mL of insulin is numerically equivalent to 1 mIU/L for this calculation, laboratories may display either unit. Confirm the actual unit before calculating.
For example, fasting insulin of 12 µIU/mL and fasting glucose of 95 mg/dL produce:
12 × 95 ÷ 405 = 2.81
If glucose is 5.3 mmol/L, the equivalent calculation is:
12 × 5.3 ÷ 22.5 = 2.83
The tiny difference comes from rounding the glucose conversion.
| Fasting glucose | Fasting insulin | Approximate HOMA1-IR | General pattern |
|---|---|---|---|
| 85 mg/dL | 5 µIU/mL | 1.05 | Low fasting insulin requirement |
| 95 mg/dL | 12 µIU/mL | 2.81 | Higher compensatory insulin |
| 108 mg/dL | 20 µIU/mL | 5.33 | Markedly elevated fasting index |
| 140 mg/dL | 4 µIU/mL | 1.38 | Potential insulin deficiency despite modest index |
The last example shows why the score cannot be interpreted mechanically. High glucose with low insulin may occur when beta cells cannot produce enough insulin. The calculated HOMA-IR may look modest even though glucose metabolism is clearly abnormal.
HOMA2 is an updated computer model. It accounts for the nonlinear relationship between glucose and insulin, variations in hepatic and peripheral glucose resistance, and urinary glucose loss at higher glucose concentrations. Depending on the software, it can use insulin or C-peptide. HOMA1 and HOMA2 values are not interchangeable, and a cutoff derived for one should not be applied to the other.
Online calculators can reduce arithmetic errors, but they can also create hidden problems. Confirm whether the calculator uses HOMA1 or HOMA2, which glucose unit it expects, whether insulin or C-peptide is entered, and whether its stated reference categories come from a relevant population.
Preparing for the Test
A valid HOMA-IR depends on a true fasting steady state. Most protocols use an overnight fast of 8 to 12 hours. Water is usually allowed. Caloric drinks, cream or sugar in coffee, gum containing carbohydrate, and snacks end the fast.
For the most reproducible result:
- Schedule the draw in the morning after a normal night’s sleep.
- Avoid vigorous exercise the evening before and morning of testing unless the clinician says otherwise.
- Avoid heavy alcohol intake and unusually large meals before the test.
- Do not smoke or use nicotine immediately before collection.
- Sit quietly for several minutes before the blood draw.
- Take or hold medicines only according to the ordering clinician’s instructions.
- Have glucose and insulin collected in the same draw or at the same time point.
Acute stress can raise glucose and alter insulin. Fever, infection, surgery, injury, severe pain, sleep deprivation, and corticosteroid treatment may make a result unrepresentative of usual metabolism. Testing during an acute illness is sometimes clinically necessary, but it should not be treated as a routine baseline.
Medication context matters. Glucocorticoids, some antipsychotics, certain HIV therapies, calcineurin inhibitors, and other drugs can worsen insulin resistance. Metformin, weight-loss therapies, exercise interventions, and caloric restriction can improve fasting measures. Exogenous insulin makes HOMA-IR difficult or impossible to interpret because the insulin assay may measure injected insulin, endogenous insulin, or both, depending on the product and laboratory method.
Pregnancy is a special physiological state. Insulin resistance normally changes across gestation, and pregnancy-specific research thresholds vary. HOMA-IR is not a substitute for recommended gestational diabetes screening and diagnostic protocols.
Children and adolescents also require age- and puberty-aware interpretation. Insulin sensitivity normally falls during puberty and later improves. Adult cutoffs should not be applied automatically.
If results will be tracked over time, keep the conditions consistent: similar fasting duration, draw time, laboratory, medication timing, and illness status. A small change under mismatched conditions may be noise rather than true improvement or worsening.
Normal Range and Cutoffs
No international organization has established one universal HOMA-IR cutoff. Published thresholds often range around 2.0 to 3.0 in adults, but some studies use lower or higher values. The number depends on the population, assay, statistical method, body composition, age, sex, ethnicity, glucose status, and whether HOMA1 or HOMA2 is used.
Researchers commonly define insulin resistance by:
- The upper percentile of HOMA-IR in a healthy reference population
- A cutoff that best predicts metabolic syndrome, impaired glucose tolerance, fatty liver, or clamp-defined resistance
- Population-specific quartiles or quintiles
- A threshold selected from prior research for consistency
These approaches produce different answers. A score above 2.5 may be considered elevated in one study, borderline in another, and unclassified in a third. Even fasting insulin assays are not fully standardized across manufacturers. Because insulin is multiplied by glucose, assay bias passes directly into HOMA-IR.
A practical clinical interpretation uses ranges as context, not diagnosis:
- Around 1 or lower often indicates a low fasting insulin requirement in metabolically healthy adults, provided glucose is normal and insulin production is intact.
- Around 1.5 to 2.5 may be compatible with normal, borderline, or elevated values depending on the laboratory and population.
- Above roughly 2.5 to 3 often raises suspicion for insulin resistance in adult research, but it is not a universal medical cutoff.
- Much higher scores usually reflect substantial fasting hyperinsulinemia, elevated glucose, or both, yet clinical context remains necessary.
A laboratory-specific reference interval is preferable to an online category. One recent population study proposed adult reference intervals for fasting insulin and HOMA-IR, illustrating that local assay and population selection materially affect the limits.
HOMA-IR should not be described as an “optimal” score without defining the evidence, method, and population. Lower is not always better. A very low score caused by inadequate insulin production can coexist with high glucose and diabetes. The interpretation must verify that beta-cell output is sufficient.
High HOMA-IR Results
A high HOMA-IR generally means fasting insulin is elevated relative to fasting glucose. The pancreas may be compensating for reduced insulin sensitivity, especially in the liver.
Common associations include:
- Abdominal or visceral obesity
- Physical inactivity
- Genetic susceptibility to type 2 diabetes
- Prediabetes or type 2 diabetes with preserved insulin secretion
- Metabolic dysfunction-associated steatotic liver disease
- Polycystic ovary syndrome
- Obstructive sleep apnea
- Chronic sleep restriction
- Glucocorticoid exposure
- Some antipsychotic and immunosuppressive medicines
- Puberty, pregnancy, or other physiological states with altered insulin sensitivity
- Acute illness, inflammation, or stress hormones
A high score is often accompanied by elevated triglycerides, low HDL cholesterol, increased waist circumference, higher blood pressure, or elevated liver enzymes. These features strengthen the impression of cardiometabolic risk but are not required.
The fasting glucose component may still be normal. For example, a fasting glucose of 92 mg/dL and insulin of 25 µIU/mL produce a HOMA-IR of about 5.7. Glucose appears reassuring only because the pancreas is releasing a large amount of insulin. This compensatory phase can persist for years.
A high result should prompt confirmation of fasting conditions and review of the insulin assay. Then assess established risk markers rather than treating the index in isolation. Useful follow-up may include A1C, repeat fasting glucose, lipid profile, blood pressure, waist circumference, liver enzymes, kidney function, and evaluation for sleep apnea or polycystic ovary syndrome when symptoms fit.
HOMA-IR is not a medication target with an approved dose-adjustment algorithm. Treatment focuses on the underlying risk pattern: sustainable nutrition changes, regular aerobic and resistance activity, adequate sleep, weight management when appropriate, smoking cessation, and evidence-based treatment of blood pressure, lipids, diabetes, or related conditions.
Low HOMA-IR Results
A low HOMA-IR can reflect excellent insulin sensitivity, but it can also result from low insulin production. The glucose value determines which interpretation is more plausible.
A low score with normal fasting glucose and no symptoms often indicates that the body needs little insulin to maintain fasting glucose. This can occur in lean, active people and after meaningful improvement in weight, activity, sleep, or metabolic treatment.
A low score deserves caution when fasting glucose is elevated. Possible explanations include:
- Type 1 diabetes or another form of insulin deficiency
- Advanced type 2 diabetes with beta-cell failure
- Pancreatic disease or surgery
- A falsely low insulin result from assay limitations
- An insulin analog that is not detected by the assay
- Incorrect unit entry or calculation
For example, glucose of 180 mg/dL and insulin of 2 µIU/mL produce a HOMA-IR below 1. This does not mean excellent metabolic health. It suggests that insulin secretion may be inadequate for the glucose level.
Very low glucose can also lower the product. If the person has symptoms of hypoglycemia, interpretation should focus on a properly documented low plasma glucose episode and paired hormone results. HOMA-IR is not designed to diagnose hypoglycemia or insulinoma.
When insulin production is uncertain, a C-peptide test may help because C-peptide is released with endogenous insulin and is not present in injected insulin. Kidney function, glucose level, and timing still affect C-peptide interpretation.
Do not attempt to reduce HOMA-IR toward zero. A healthy fasting system requires enough insulin to keep glucose stable. The desirable pattern is appropriate insulin for the glucose level, not the smallest possible number.
Limitations and Common Errors
HOMA-IR is convenient, but several limitations can materially change the conclusion.
Insulin assays are not harmonized
Different immunoassays may report different insulin concentrations from the same specimen. Cross-reactivity with proinsulin or insulin analogs varies. A HOMA-IR trend is most credible when the same assay is used.
The model assumes a stable fasting feedback loop
Recent food, stress, exercise, hypoglycemia, acute illness, and medication changes violate that assumption. Insulin is secreted in pulses, so one blood sample also contains normal biological variation. Some research protocols average two or three fasting samples to improve precision.
It is less reliable at extremes
Marked hyperglycemia, severe insulin deficiency, very high insulin, advanced liver or kidney disease, and exogenous insulin can make the model unreliable. HOMA2 has a defined input range; values outside it should not be forced into a calculator.
It emphasizes fasting hepatic physiology
A person may have normal fasting values yet show abnormal post-meal glucose handling or muscle insulin resistance. An oral glucose tolerance test, continuous glucose data, or a validated dynamic index may reveal abnormalities that HOMA-IR misses.
Cutoff borrowing creates false precision
Applying a threshold from a different country, ethnicity, age group, pregnancy cohort, assay, or disease population can misclassify a result. Decimal places do not compensate for a mismatched reference.
Common calculation mistakes include entering mg/dL into the mmol/L formula, using nonfasting insulin, mixing glucose and insulin from different days, confusing HOMA1 with HOMA2, and copying a laboratory’s upper insulin limit as a HOMA-IR cutoff.
HOMA-IR should also not be used to claim that a person is “metabolically healthy” while ignoring A1C, blood pressure, triglycerides, liver disease, or smoking. It represents one narrow part of cardiometabolic assessment.
Using Results and Planning Follow-Up
Review the result in a structured order:
- Confirm a true 8- to 12-hour fast and simultaneous collection.
- Verify glucose and insulin units.
- Identify whether the calculation used HOMA1 or HOMA2.
- Compare with the laboratory’s method-specific information, not a generic internet chart.
- Look at fasting glucose, A1C, lipids, blood pressure, waist circumference, and liver markers.
- Review medications, recent illness, sleep, activity, pregnancy, and puberty.
- Decide whether the number changes a clinical action.
If glucose meets a diabetes threshold, follow validated diabetes confirmation and classification pathways rather than repeating HOMA-IR as the main test. A high HOMA-IR with normal glucose may support an early compensatory pattern, but management is still based on overall risk and sustainable interventions.
For trend monitoring, repeat testing after enough time for the intervention to have an effect—often several months rather than several days. Day-to-day changes in sleep, stress, exercise, and assay variation can move fasting insulin. Use the same laboratory and similar conditions.
A decline in HOMA-IR is most convincing when accompanied by other improvements, such as lower fasting insulin without rising glucose, better triglycerides, reduced waist circumference, improved liver enzymes, or improved glucose tolerance. A lower index caused by falling insulin and rising glucose is not improvement.
When a more precise answer is needed, an endocrinologist or metabolic specialist may use a mixed-meal test, oral glucose tolerance test with insulin measurements, frequently sampled intravenous glucose testing, or a clamp study. These are selected according to the question, not simply because HOMA-IR is above a chosen number.
The HOMA-IR score can translate two fasting laboratory values into a useful snapshot. Its greatest value comes from modest interpretation: it estimates insulin resistance, it does not define it universally, and it must make biological sense alongside glucose and pancreatic function.
Worked Interpretation Examples
Consider two people with the same HOMA-IR value. One has fasting glucose of 88 mg/dL, elevated fasting insulin, central adiposity, high triglycerides, and fatty liver. The score supports compensatory insulin resistance. The other has fasting glucose of 126 mg/dL and only modest insulin because beta-cell reserve is declining. The same mathematical result may underestimate the seriousness of the second pattern. Absolute glucose and insulin values must therefore remain visible.
A low HOMA-IR also has more than one meaning. It may reflect good insulin sensitivity in a healthy person, but it can also occur when the pancreas cannot produce enough insulin. Low insulin with weight loss, thirst, frequent urination, ketones, or rising glucose requires diabetes evaluation, including C-peptide and autoantibodies when appropriate.
For monitoring, use standardized fasting collections and look for change beyond ordinary day-to-day noise. A small decimal difference may come from sleep, stress, exercise, or assay variation. A sustained reduction accompanied by improved glucose, triglycerides, waist circumference, blood pressure, and liver markers is more persuasive than the score alone.
Because insulin assays differ, a personal trend is easier to interpret when the same laboratory and units are used each time.
References
- Mini-review on insulin resistance assessment: Advances in surrogate indices and clinical applications 2025 (Review)
- Proposal for fasting insulin and HOMA-IR reference intervals based on an extensive Brazilian laboratory database 2024
- Evaluating indices of insulin resistance and estimating the prevalence of insulin resistance in a large biobank cohort 2025
- 2. Diagnosis and Classification of Diabetes: Standards of Care in Diabetes—2026 2026 (Guideline)
- Insulin resistance markers HOMA-IR, TyG and TyG-BMI index as predictors of metabolic syndrome in adults 2025
Disclaimer
This article provides general information and does not diagnose insulin resistance, prediabetes, or diabetes. HOMA-IR cutoffs vary by assay and population, and the score may be misleading during illness, pregnancy, insulin treatment, or impaired insulin secretion. Discuss abnormal glucose or insulin results with a qualified clinician before changing medication or diet.