
An insulin resistance blood test panel combines fasting insulin and glucose with calculated HOMA-IR and, in some panels, C-peptide. The tests show how much pancreatic hormone output is needed to maintain fasting glucose and whether endogenous insulin production appears preserved. They can support a metabolic assessment, but there is no universally standardized “insulin resistance panel,” and no single result proves or excludes insulin resistance. Fasting glucose and A1C identify abnormal glycemia using validated thresholds; insulin and HOMA-IR add context about compensation; C-peptide reflects pancreatic secretion but is strongly affected by glucose and kidney function. Results are most useful when collected after a true overnight fast, measured by the same laboratory over time, and interpreted with waist circumference, blood pressure, lipids, liver markers, medications, sleep, activity, and clinical conditions such as polycystic ovary syndrome. A normal glucose result can coexist with high insulin, while low insulin or C-peptide with high glucose can indicate declining beta-cell function rather than good insulin sensitivity.
- The core panel usually includes fasting glucose and fasting insulin; HOMA-IR is calculated from those two values.
- C-peptide can confirm endogenous insulin production but is not a direct measure of insulin sensitivity.
- There is no universal HOMA-IR or fasting-insulin cutoff because assays and populations differ.
- High insulin with normal glucose often suggests compensation; high glucose with low C-peptide suggests reduced beta-cell reserve.
- The panel does not diagnose diabetes, which relies on validated glucose and A1C criteria.
Table of Contents
- What the Panel Includes
- Who May Benefit From Testing
- How to Prepare and Collect the Panel
- Understanding Each Result
- Common Result Patterns
- Normal Ranges and Cutoff Problems
- Limitations and Missing Pieces
- Follow-Up and Improving Metabolic Risk
What the Panel Includes
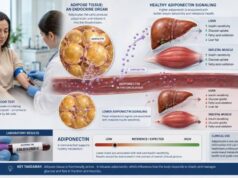
The panel is a collection of related tests rather than a single standardized order. Different laboratories may add A1C, lipids, triglycerides, liver enzymes, adiponectin, leptin, or inflammatory markers. The most defensible core includes simultaneous fasting glucose and fasting insulin, with HOMA-IR calculated from them. C-peptide may be added when the clinician wants more information about pancreatic secretion.
Fasting glucose measures the concentration of glucose after an overnight fast. It reflects the balance between liver glucose production and insulin action. A normal fasting result does not guarantee normal post-meal handling, but it is an established part of diabetes and prediabetes assessment.
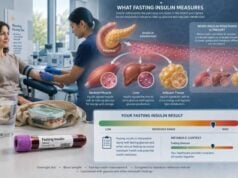
Fasting insulin measures circulating immunoreactive insulin. Early in insulin resistance, beta cells may release more insulin to keep glucose controlled. Insulin assays differ among laboratories, so numbers are not fully interchangeable.
HOMA-IR estimates insulin resistance using fasting insulin and glucose. The original calculation is:
- Insulin (µIU/mL) × glucose (mg/dL) ÷ 405
- Insulin (µIU/mL) × glucose (mmol/L) ÷ 22.5
The updated HOMA2 model uses a computer algorithm and may accept insulin or C-peptide. HOMA1 and HOMA2 values should not be mixed.
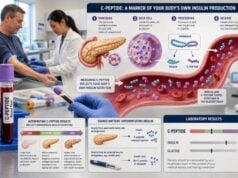
C-peptide is released when beta cells split proinsulin into insulin and C-peptide. Because injected insulin contains no C-peptide, the marker helps estimate endogenous secretion. It circulates longer than insulin and is cleared mainly by the kidneys. A C-peptide result must therefore be interpreted with simultaneous glucose and kidney function.
A useful panel may also include:
- A1C for average glycemia over roughly the prior two to three months
- Triglycerides and HDL cholesterol
- LDL cholesterol or apolipoprotein B for atherosclerotic risk
- Alanine aminotransferase and other liver tests
- Blood pressure and waist circumference, which are not blood tests but are central to risk
- Thyroid, cortisol, or reproductive hormone testing when symptoms suggest another endocrine disorder
Adding more biomarkers does not automatically improve accuracy. Every component should answer a defined question and have an interpretation plan.
Who May Benefit From Testing
A clinician may consider this panel when insulin resistance is plausible but routine glucose tests do not fully explain the pattern. Examples include:
- Central weight gain or increased waist circumference
- Elevated triglycerides, low HDL cholesterol, or fatty liver
- Acanthosis nigricans, a dark velvety skin change often seen around the neck or underarms
- Polycystic ovary syndrome with irregular cycles or hyperandrogenism
- A strong family history of type 2 diabetes
- Prior gestational diabetes
- Obstructive sleep apnea
- Long-term glucocorticoid or selected antipsychotic treatment
- Unexplained fasting hyperinsulinemia found on prior testing
- Monitoring a structured metabolic intervention under consistent conditions
The panel is not required for everyone at risk of diabetes. Standard screening with fasting plasma glucose, A1C, or an oral glucose tolerance test often provides the information needed for prevention and treatment. These tests have outcome-based thresholds and broad guideline support.
C-peptide is most helpful when secretion itself is in question—for example, when high glucose seems inconsistent with the insulin value, diabetes type is uncertain, or the clinician wants to know whether beta-cell reserve is declining. It is not routinely necessary just to calculate HOMA-IR.
Situations where the panel may mislead include:
- Current insulin treatment
- Acute infection, surgery, or severe stress
- Pregnancy without pregnancy-specific interpretation
- Puberty without age- and stage-specific reference data
- Advanced kidney disease
- Marked hyperglycemia or known severe insulin deficiency
- A recent meal or caloric drink
People sometimes seek testing because of fatigue, hunger, weight difficulty, or afternoon sleepiness. These symptoms are nonspecific. Insulin resistance may contribute, but anemia, sleep disorders, medication effects, depression, thyroid disease, inadequate nutrition, and other conditions can produce the same complaints.
A panel should not be used to label a person as “metabolically broken” based on one borderline score. The purpose is to clarify risk and guide practical next steps.
How to Prepare and Collect the Panel
Most protocols require an 8- to 12-hour overnight fast. Water is generally allowed. Calorie-containing drinks, cream or sugar in coffee, snacks, and carbohydrate-containing gum end the fast.
For a reproducible baseline:
- Eat normally during the preceding days rather than using an unusual crash diet.
- Avoid heavy alcohol intake before the test.
- Avoid strenuous exercise the evening before and morning of collection.
- Obtain a normal night of sleep when possible.
- Do not smoke or use nicotine immediately before the draw.
- Sit quietly for several minutes before collection.
- Follow the clinician’s medication instructions.
Do not independently stop metformin, insulin, a GLP-1 receptor agonist, a steroid, or another medicine. The clinician must decide whether testing should reflect the usual treated state or a safe, supervised medication adjustment.
Glucose, insulin, and C-peptide should be drawn at the same time. Using a glucose result from one day and insulin from another invalidates HOMA-IR. The actual fasting duration and draw time should be documented.
Acute illness can temporarily raise stress hormones and worsen insulin resistance. Fever, infection, surgery, pain, sleep deprivation, and emotional stress may produce a score that does not represent the person’s usual state. Testing may still be necessary, but the result should not be treated as a stable baseline.
Assay continuity matters for trends. Insulin methods are not harmonized, and a laboratory platform change can alter the result. If the panel will be repeated, use the same laboratory when feasible and keep timing, fasting, medications, and activity similar.
C-peptide specimen requirements differ by laboratory. Some use serum, others plasma, and storage conditions vary. Kidney function should be measured or known because reduced clearance can raise C-peptide independently of secretion.
Understanding Each Result
The panel should be read as a coordinated system, not as four independent pass/fail tests.
Fasting glucose
Fasting plasma glucose below 100 mg/dL is generally below the prediabetes threshold. Values from 100 to 125 mg/dL meet the fasting glucose range for prediabetes, and 126 mg/dL or higher can meet a diabetes criterion when confirmed appropriately in the absence of unequivocal hyperglycemia. Laboratory and clinical context still matter.
A normal fasting glucose can coexist with significant post-meal abnormalities or high compensatory insulin. A1C or oral glucose testing may reveal a different pattern.
Fasting insulin
Reference intervals often span roughly 2 to 25 µIU/mL, but the laboratory’s assay-specific range controls. A value in the upper part of a broad interval may be appropriate or excessive depending on fasting glucose, body composition, medication use, and the reference population.
The fasting insulin result is most useful when it answers how much insulin is needed to maintain the measured glucose. A high value with normal glucose often represents compensation; a low value with high glucose may represent inadequate secretion.
HOMA-IR
Higher HOMA-IR usually suggests greater fasting insulin resistance. Published adult cutoffs often fall around 2 to 3, but values vary by ethnicity, age, sex, assay, weight distribution, disease state, and research method. The score primarily reflects fasting hepatic physiology and may miss muscle insulin resistance that appears after meals.
C-peptide
High C-peptide with high or normal glucose indicates substantial endogenous insulin secretion. It can accompany insulin resistance, obesity, type 2 diabetes, kidney dysfunction, or an insulin-releasing drug. Low C-peptide with high glucose suggests limited beta-cell reserve. Low C-peptide with low glucose may be an appropriate fasting response.
A fasting C-peptide value cannot be interpreted without glucose. A result that appears low at a glucose of 75 mg/dL may be appropriate, while the same value at 250 mg/dL may indicate severe insulin deficiency.
Common Result Patterns
Several patterns appear repeatedly in metabolic evaluation.
| Glucose | Insulin/HOMA-IR | C-peptide | Possible interpretation |
|---|---|---|---|
| Normal | High | Normal-high or high | Compensated insulin resistance |
| Prediabetes range | High | High | Insulin resistance with incomplete compensation |
| Diabetes range | High | Preserved or high | Type 2 pattern with substantial secretion |
| High | Low or modest | Low | Insulin deficiency or advanced beta-cell failure |
| Normal | Low | Low-normal | Possible high insulin sensitivity if clinically healthy |
These patterns are descriptive, not diagnostic. Kidney disease can raise C-peptide. Injected insulin can raise measured insulin depending on assay cross-reactivity while suppressing C-peptide. Insulin antibodies can produce a very high reported insulin level that does not match the free biologically active fraction.
A person can also have normal fasting values and abnormal post-meal physiology. If symptoms or risk remain concerning, an oral glucose tolerance test, mixed meal, or continuous glucose data may be more informative than repeating fasting insulin.
The panel should not be used during suspected hypoglycemia unless a true critical sample is collected. During low glucose, the interpretation shifts from insulin resistance to whether insulin is appropriately suppressed. That evaluation requires insulin, C-peptide, proinsulin, beta-hydroxybutyrate, and a medication screen.
A falling HOMA-IR over time is reassuring only when glucose remains stable or improves. If insulin falls because beta cells are failing while glucose rises, the lower score is not metabolic improvement.
Normal Ranges and Cutoff Problems
Glucose has established clinical decision thresholds. Insulin, C-peptide, and HOMA-IR do not share the same degree of standardization.
Insulin immunoassays use different antibodies and calibrators. Cross-reactivity with proinsulin and insulin analogs varies. A fasting insulin of 15 µIU/mL may fall comfortably within one laboratory’s interval and near the upper limit of another.
HOMA-IR multiplies insulin by glucose, so any insulin assay bias moves directly into the score. A cutoff derived from one platform may not transfer to another. Population-based thresholds also vary because insulin sensitivity differs with age, puberty, pregnancy, ethnicity, body composition, and lifestyle.
C-peptide intervals vary by fasting state and method. Stimulated C-peptide is expected to be higher than fasting C-peptide. Kidney dysfunction raises the level by reducing clearance. A single “normal range” cannot determine beta-cell adequacy without simultaneous glucose.
Terms such as optimal insulin, ideal HOMA-IR, and metabolic age are often presented with false precision. A reasonable goal is not to force every value below an internet threshold. It is to improve overall metabolic health while preserving adequate insulin secretion and avoiding hyperglycemia.
When a laboratory provides an interpretation, check whether it is:
- A true reference interval from healthy participants
- A disease-prediction cutoff from a specific study
- A percentile within the tested population
- A HOMA1 or HOMA2 value
- Intended for adults, children, pregnancy, or another subgroup
These categories are not interchangeable.
Limitations and Missing Pieces
The panel estimates fasting physiology and cannot fully capture insulin resistance in skeletal muscle, meal responses, or day-to-day glucose variability. The hyperinsulinemic-euglycemic clamp remains a research reference method but is impractical for routine care.
Important limitations include:
- One-time sampling: Insulin is secreted in pulses and varies biologically.
- Fasting emphasis: HOMA-IR mainly reflects hepatic resistance.
- Assay variation: Insulin values differ across platforms.
- Beta-cell dependence: Low insulin secretion can make HOMA-IR look deceptively favorable.
- Kidney effects: C-peptide and insulin clearance change with kidney function.
- Medication effects: Steroids, antipsychotics, insulin, and glucose-lowering drugs alter results.
- Physiological states: Pregnancy and puberty require special interpretation.
- No direct outcome threshold: The score does not itself define when medication must start.
The panel also omits several major risk dimensions. Blood pressure, smoking, sleep apnea, dietary pattern, physical activity, family history, body fat distribution, lipids, and liver disease may be more actionable than a small change in fasting insulin.
A1C can be misleading when red blood cell lifespan is altered by anemia, hemoglobin variants, blood loss, transfusion, kidney disease, or pregnancy. Fasting glucose can vary with stress and sleep. No single test is perfect, which is why clinicians combine them.
The panel should not replace evaluation for secondary causes when features are atypical. Rapid weight gain, purple striae, muscle weakness, severe hypertension, or unusual medication exposure may justify assessment for cortisol excess. Irregular cycles and androgen symptoms may suggest polycystic ovary syndrome. Marked thirst, urination, weight loss, or ketosis requires prompt diabetes evaluation.
Follow-Up and Improving Metabolic Risk
Follow-up begins with the most established results. If fasting glucose or A1C meets a diabetes threshold, confirm and classify diabetes according to clinical standards. If results indicate prediabetes, assess overall risk and discuss an evidence-based prevention plan.
When glucose is normal but fasting insulin and HOMA-IR are elevated, useful next steps may include:
- Confirm the fasting conditions and repeat only if the result will change management.
- Measure A1C, triglycerides, HDL cholesterol, blood pressure, waist circumference, and liver enzymes.
- Review sleep quality and symptoms of sleep apnea.
- Review medicines that can worsen insulin resistance.
- Evaluate for polycystic ovary syndrome or fatty liver when clinically appropriate.
- Develop a sustainable nutrition and activity plan.
Regular movement improves insulin sensitivity even before major weight loss. A practical program combines aerobic activity, resistance training, and less prolonged sitting. Nutrition should emphasize a pattern that the person can maintain, with adequate protein and fiber, minimally processed foods, and appropriate energy intake. Sleep duration and treatment of sleep apnea can materially affect glucose regulation.
Weight loss is not the only outcome, but a clinically meaningful reduction in excess body weight often improves fasting insulin, liver fat, triglycerides, blood pressure, and glucose. Medication or metabolic surgery may be appropriate for some people based on obesity, diabetes, cardiovascular, kidney, or liver indications—not merely one HOMA-IR value.
If repeating the panel, wait long enough for a real physiological change, often about three months or more. Use the same laboratory and similar collection conditions. Judge progress by a coordinated pattern: lower insulin with stable or lower glucose, improved lipids, reduced waist circumference, better liver markers, and improved fitness. A single decimal-point change in HOMA-IR is less important than that broader improvement.
An insulin resistance panel is most valuable when it adds context without pretending to be definitive. Fasting glucose identifies glycemia, insulin shows compensation, HOMA-IR summarizes their relationship, and C-peptide shows endogenous beta-cell output. Together they can clarify a metabolic pattern, but clinical risk and established diagnostic tests still guide care.
How to Handle Discordant Panel Results
Discordance is common because the markers describe different parts of glucose regulation. High fasting insulin with normal glucose often indicates successful compensation. High glucose with only modest insulin may indicate that beta cells are no longer matching demand. A normal HOMA-IR does not erase an abnormal fasting glucose, and a high HOMA-IR does not diagnose diabetes when glucose criteria are normal.
C-peptide can clarify endogenous output, but kidney dysfunction may raise it through reduced clearance. A low C-peptide in marked hyperglycemia is more concerning for limited beta-cell reserve than the same value during low-normal glucose. Recent food intake, injected insulin, secretagogues, acute illness, and glucocorticoids can further separate the markers.
When one result is surprising, first check the basics: fasting duration, collection time, hemolysis, medication timing, laboratory reference intervals, and whether insulin and glucose came from the same draw. Repeating the panel under standardized conditions is preferable to averaging incompatible specimens from different days or laboratories.
The broader phenotype decides what the numbers mean. Waist circumference, blood pressure, triglycerides, HDL cholesterol, liver fat, sleep apnea, menstrual or androgen symptoms, family history, and activity level can support or weaken an insulin-resistance interpretation. Conversely, weight loss, thirst, polyuria, ketones, or rapid deterioration should shift attention toward insulin deficiency.
A practical follow-up matrix is:
| Pattern | Likely question | Useful next step |
|---|---|---|
| Normal glucose, high insulin/HOMA-IR | Compensated resistance | Assess cardiometabolic risk and repeat only after meaningful intervention |
| High glucose, high insulin | Resistance with inadequate compensation | Confirm glycemic diagnosis and treat established risk |
| High glucose, low insulin/C-peptide | Reduced beta-cell reserve | Evaluate diabetes type, ketones, pancreatic history, and autoantibodies |
| Normal glucose, isolated high C-peptide | Clearance, recent food, or endogenous secretion | Review kidney function and collection conditions |
| Low glucose with detectable insulin | Possible insulin-mediated hypoglycemia | Obtain a properly timed critical-sample panel |
These patterns guide questions rather than provide final diagnoses. Established glucose and A1c criteria, symptoms, and organ-specific evaluation remain the basis for clinical decisions.
References
- Mini-review on insulin resistance assessment: Advances in surrogate indices and clinical applications 2025 (Review)
- Proposal for fasting insulin and HOMA-IR reference intervals based on an extensive Brazilian laboratory database 2024
- Evaluation of insulin secretion and insulin sensitivity in pregnant women: Application value of simple indices 2024 (Review)
- 2. Diagnosis and Classification of Diabetes: Standards of Care in Diabetes—2026 2026 (Guideline)
- 3. Prevention or Delay of Diabetes and Associated Comorbidities: Standards of Care in Diabetes—2026 2026 (Guideline)
Disclaimer
This article is for general education and does not diagnose insulin resistance, prediabetes, or diabetes. Insulin, C-peptide, and HOMA-IR require method-specific interpretation with glucose, kidney function, medications, and clinical context. Do not change diabetes or weight-management treatment based on a home calculation without medical guidance.