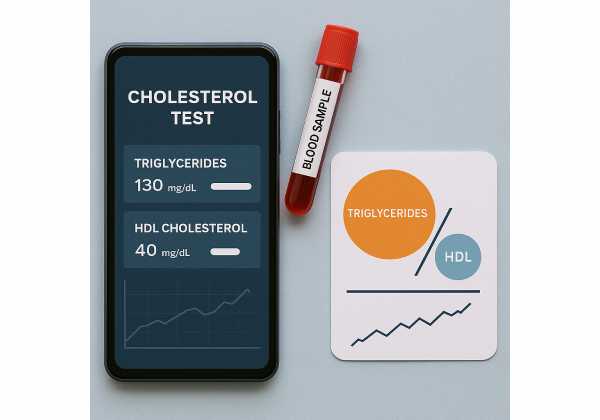
The triglyceride to HDL cholesterol (TG\:HDL) ratio turns two familiar lipid numbers into a compact snapshot of metabolic status. Because triglycerides reflect how the body handles dietary fat and hepatic output, while HDL participates in reverse cholesterol transport, the ratio captures the push–pull between fat storage and lipid clearance. Lower is generally better. You can calculate it yourself, track it over time, and combine it with other markers to flag insulin resistance early—often before glucose values drift. This guide explains why the ratio matters, how to interpret it alongside ApoB and A1c, what can skew a reading, and when a high result warrants more evaluation. If you are building a broader testing plan, see our overview of assessing biomarkers and tools for longevity for context on where TG\:HDL fits.
Table of Contents
- How to Calculate TG:HDL and Why It’s Useful
- Fasting vs Non-Fasting: Does It Matter for This Ratio?
- Interpreting Ratios Alongside Other Markers (ApoB, A1c)
- What Can Skew the Ratio: Alcohol, Illness, Medications
- Retesting Cadence and Trend Tracking
- When High Ratios Suggest Further Evaluation
How to Calculate TG:HDL and Why It’s Useful
The TG\:HDL ratio is simple arithmetic: divide your triglycerides by your HDL cholesterol from the same lipid panel. The ratio is unit-specific, so use the same units for both values. In the United States, labs typically report in mg/dL. Many other countries use mmol/L. Because triglycerides and HDL use different conversion factors, ratios in mg/dL are not numerically equal to ratios in mmol/L. As a quick orientation, multiplying a mmol/L ratio by ~2.2 approximates the mg/dL ratio (and dividing a mg/dL ratio by ~2.2 approximates the mmol/L ratio). Always check which units your report uses.
Example (mg/dL):
- Triglycerides 120 mg/dL ÷ HDL 60 mg/dL = TG\:HDL = 2.0
Example (mmol/L):
- Triglycerides 1.4 mmol/L ÷ HDL 1.3 mmol/L = TG\:HDL ≈ 1.08 (≈ 2.4 in mg/dL terms)
Why do clinicians and researchers look at this ratio? Triglycerides rise when the liver secretes more very-low-density lipoproteins (VLDL) or when clearance of triglyceride-rich lipoproteins slows—both common in insulin resistance. HDL often falls in the same physiology. The ratio therefore acts as a compact proxy for metabolic flexibility, hepatic fat export, and triglyceride-rich lipoprotein burden. Cohort studies and meta-analyses associate higher TG\:HDL with:
- Greater odds of insulin resistance and incident type 2 diabetes.
- Higher risk of cardiovascular events, independent of standard risk factors.
- Higher likelihood of hepatic steatosis and features of metabolic syndrome.
The ratio is not a treatment target by itself. It’s a signal—a way to gauge whether diet quality, physical activity, sleep, body composition, and lipid-lowering therapy are moving metabolism in the right direction. In practical terms:
- Lower ratios are generally better, especially if driven by lower triglycerides and stable or higher HDL.
- Trends beat snapshots. A ratio drifting from 3.2 to 2.4 (mg/dL units) over six months is meaningful progress.
- Context matters. Elevated ApoB or non-HDL cholesterol indicates atherogenic particle burden even if the TG\:HDL ratio looks acceptable. Conversely, a high ratio may reveal insulin resistance even when LDL-C is average.
Useful mental benchmarks (mg/dL units) that fit many adult cohorts:
- Around 2 or lower is typically favorable.
- ~2–3 is a yellow light to tighten lifestyle basics and check companion markers.
- ≥3–3.5 often points to insulin resistance physiology; confirm with additional testing.
Because populations differ (age, sex, ancestry, menopausal status), interpret values alongside other risk markers and your clinical picture rather than using a hard cut-off.
Fasting vs Non-Fasting: Does It Matter for This Ratio?
Triglycerides are the most meal-responsive part of a standard lipid panel, so it’s natural to ask whether the TG\:HDL ratio requires fasting. Here is a pragmatic way to think about it.
What changes after eating?
- Triglycerides typically rise modestly after meals as chylomicrons and VLDL carry dietary and hepatic fat. The peak usually occurs a few hours post-meal.
- HDL varies much less acutely than triglycerides across the day.
- Because the ratio is TG divided by HDL, non-fasting draws tend to nudge the ratio upward compared with a true fasting sample, but the change is usually small for most people eating their usual diet.
When non-fasting is reasonable
- Routine screening and trend monitoring. Many health systems and laboratories accept non-fasting lipids for initial assessment. If logistics make fasting difficult, a non-fasting panel taken under typical conditions (e.g., mid-morning) gives a useful baseline for TG\:HDL and other lipids.
- On statin therapy. Differences between fasting and non-fasting lipids are generally small even in those taking statins. If your schedule or clinic workflow favors a random draw, you can often proceed.
When fasting is better
- Very high non-fasting triglycerides. If a non-fasting panel shows triglycerides above about 400–500 mg/dL (4.5–5.7 mmol/L), repeat in the fasting state to confirm and evaluate secondary causes.
- Before starting or changing therapy when precision matters. If treatment decisions hinge on LDL-C by the Friedewald equation or you are targeting a specific triglyceride threshold, a fasting draw reduces noise.
- If you recently had an unusually large or alcohol-heavy meal. Postprandial spikes can transiently distort triglycerides; a fasting sample avoids this confound.
Practical tips
- Be consistent. If you are trending the ratio, try to test under similar conditions each time (same time of day; either always fasting or always not).
- Note the context. Record whether you fasted and what time the sample was taken. Small day-to-day shifts are less important than multi-month trends.
- Pair with particle burden. Regardless of fasting status, pair the ratio with ApoB or non-HDL cholesterol to quantify atherogenic particles. For a deeper dive on why ApoB makes risk estimation more precise, see our guide to primary lipid markers.
Bottom line: fasting is not strictly necessary for most uses of TG\:HDL, but a fasting sample is wise when triglycerides are very high, when a precise LDL-C calculation is needed, or when you want to minimize variability during intensive interventions.
Interpreting Ratios Alongside Other Markers (ApoB, A1c)
The TG\:HDL ratio works best as part of a small interpretive bundle that captures both atherosclerotic risk and metabolic flexibility.
ApoB (or non-HDL cholesterol) — particle burden
- ApoB counts the number of atherogenic lipoprotein particles (VLDL, IDL, LDL, and Lp(a)). The higher the ApoB, the more particles capable of depositing cholesterol in the arterial wall.
- Two people can share the same LDL-C but have different ApoB due to particle size and triglyceride content. In insulin resistance, triglyceride-rich, cholesterol-poor LDL can keep LDL-C “normal” while ApoB climbs.
- How it complements TG\:HDL: A high TG\:HDL ratio plus elevated ApoB signals both metabolic stress and atherogenic particle overload—strong grounds to intensify lifestyle and consider therapy. A low ratio with elevated ApoB means particle excess without marked insulin resistance; LDL-lowering remains the priority.
- Actionable targets: Discuss ApoB targets with your clinician based on overall risk. Many expert groups treat ApoB or non-HDL cholesterol as primary treatment targets rather than HDL itself.
Glucose side — A1c, fasting glucose, fasting insulin
- A1c captures average glucose over ~3 months. High TG\:HDL with a normal A1c can indicate “pre-pre-diabetes”—insulin resistance before glucose escape.
- Fasting insulin (or HOMA-IR, calculated from glucose and insulin) can confirm insulin resistance when the ratio is high but glucose remains normal.
- Continuous glucose data are valuable if available; episodes of post-meal hyperglycemia often accompany high triglycerides.
Liver and visceral fat — ALT, AST, ultrasound, waist metrics
- Hepatic fat export raises VLDL and triglycerides. Elevated ALT/AST, a high FIB-4 index, or ultrasound evidence of steatosis support a liver component.
- Simple anthropometrics—waist circumference or waist-to-height ratio—track visceral fat, which drives triglyceride elevation and lower HDL.
How to put the bundle together (illustrative)
- Scenario A: TG\:HDL 3.4 (mg/dL), ApoB high, A1c 5.7%. Priorities: LDL/ApoB lowering and insulin sensitizing moves (diet quality, fiber, resistance training, sleep, weight management).
- Scenario B: TG\:HDL 1.7, ApoB high, A1c 5.1%. Focus: particle reduction (statin, ezetimibe, PCSK9/i), with lifestyle to maintain low TG.
- Scenario C: TG\:HDL 3.0, ApoB normal, A1c 5.0% but fasting insulin high. Focus: diet pattern (lower refined starches, adequate protein), exercise that builds and uses muscle, evening meal timing, sleep.
For background on measuring the glucose side of the bundle, see our overview of A1c and fasting insulin.
What Can Skew the Ratio: Alcohol, Illness, Medications
Because the TG\:HDL ratio is sensitive to triglycerides, many short-term factors can push it up or down. When a result looks out of character, consider these influences before over-interpreting.
Short-term lifestyle factors
- Alcohol in the last 24–72 hours. Even moderate drinking can transiently elevate triglycerides by increasing hepatic VLDL production and impairing clearance. Binge intake is especially potent.
- Very high-fat or high-glycemic meals. Fat plus refined starches raise postprandial triglycerides synergistically. A late, heavy dinner the night before a morning draw can lift the ratio.
- Endurance events or severe caloric restriction. Acute energy stress may temporarily alter triglycerides and HDL; repeat once routine patterns resume.
- Sleep restriction and circadian disruption. Short sleep and night-shift schedules can worsen postprandial lipemia and lower HDL.
Illness and physiological states
- Intercurrent infection or inflammation. Cytokine shifts raise triglycerides and lower HDL as part of the acute-phase response.
- Uncontrolled hypothyroidism. Thyroid hormone regulates lipoprotein metabolism; low T4/T3 can elevate triglycerides and lower HDL.
- Kidney disease and pregnancy. Both can raise triglycerides; in late pregnancy, high TG is physiologic but merits context.
Medications with known triglyceride effects
(Always balance risks and benefits; never stop medication without clinician guidance.)
- Increase triglycerides: certain beta-blockers, thiazide diuretics, oral estrogens, tamoxifen, systemic glucocorticoids, atypical antipsychotics, some immunosuppressants, HIV protease inhibitors, and oral retinoids.
- Lower triglycerides: statins (modestly), fibrates, high-dose EPA or mixed omega-3 formulations, GLP-1 receptor agonists, and SGLT2 inhibitors.
Laboratory and pre-test variables
- Non-fasting vs fasting: Non-fasting draws typically produce a slightly higher ratio; when in doubt, use fasting for confirmation.
- Timing and consistency: Draws at different times of day, or after unusual meals, introduce noise into trend analysis.
- Sample handling and repeatability: Hemolysis or nonstandard handling can skew lipid measurements; outliers deserve a repeat.
What to do if your ratio jumps
- Audit the 72 hours before the draw. Alcohol? Unusual meals? Travel? Acute illness?
- Repeat under stable conditions within a few weeks if a single outlier conflicts with prior values.
- Check for secondary causes (thyroid, kidney, medications) if high ratios persist.
If thyroid issues are on your radar, our primer on thyroid checkpoints explains the lipid patterns that accompany low thyroid function.
Retesting Cadence and Trend Tracking
TG\:HDL is most valuable as a trend line. The right retest cadence depends on your goals, baseline risk, and whether you are actively changing diet or therapy.
Suggested timelines
- Lifestyle changes underway (nutrition, activity, weight, sleep): Recheck every 8–12 weeks until the pattern stabilizes. Triglycerides often improve within weeks; HDL usually drifts over months.
- Medication start or change (statin, ezetimibe, omega-3, GLP-1, SGLT2, fibrate): Recheck 6–12 weeks after initiation or dose change, then extend to 3–6 months once stable.
- Stable plan, low risk: Every 6–12 months is reasonable as part of routine preventive care.
How to trend with less noise
- Keep conditions similar. Same time of day, similar pre-test meal timing, either always fasting or always non-fasting.
- Log context. Note sleep, illness, travel, menstrual phase (if applicable), and recent alcohol.
- Use a small, consistent bundle. Alongside TG\:HDL, track ApoB (or non-HDL), A1c (or fasting insulin), and a simple anthropometric (e.g., waist-to-height). This triangulation anchors your trend in both particle burden and insulin sensitivity.
- Set realistic deltas. A sustained drop of ~15–30 mg/dL in triglycerides over 3–6 months (with stable HDL) often moves the ratio meaningfully. HDL shifts more slowly; expect +2–5 mg/dL over quarters, not weeks, when lifestyle is the lever.
Data-driven habits that move the ratio
- Protein-forward, fiber-rich meals. Adequate protein (≈1.2–1.6 g/kg/day for many adults unless contraindicated) and viscous fiber (oats, legumes) lower postprandial triglyceride excursions.
- Refined-starch restraint and evening meal timing. Reducing high-glycemic load and avoiding late, heavy dinners blunts overnight triglyceride rise.
- Muscle as a glucose sink. Two to three weekly sessions of resistance training and daily walking after meals improve triglyceride clearance and raise HDL modestly.
- Sleep and alcohol hygiene. Target 7–8 hours of consistent sleep; limit alcohol to low-risk patterns or avoid it while you normalize triglycerides.
For simple at-home anthropometrics that correlate with visceral fat, consider waist-to-height tracking alongside lab trends.
When High Ratios Suggest Further Evaluation
A single high TG\:HDL ratio is not a diagnosis; it is a prompt to look closer. The stakes rise when elevations are persistent and accompanied by other risk signals.
Thresholds and persistence
- If your ratio is ≥3.0–3.5 (mg/dL units) on two or more well-controlled draws, treat it as a bona fide signal rather than a bad day at the lab. In mmol/L terms, that’s roughly ≥1.3–1.6.
- The signal is stronger if triglycerides themselves are high (e.g., ≥175 mg/dL) or if HDL is unusually low for age and sex.
Next steps worth discussing with your clinician
- Quantify particle burden. Order ApoB (or non-HDL cholesterol). High ApoB changes the priority from “metabolic tune-up” to definitive atherosclerotic risk reduction.
- Screen for insulin resistance and glucose dysregulation. A1c, fasting glucose, and optionally fasting insulin (or HOMA-IR). CGM can uncover post-meal spikes that align with high triglycerides.
- Rule out secondary causes. TSH for hypothyroidism; medication review (beta-blockers, thiazides, oral estrogens, glucocorticoids, atypical antipsychotics, retinoids, HIV therapy); kidney and liver panels; consider hepatic ultrasound or elastography if NAFLD is suspected.
- Lipoprotein(a). Elevated Lp(a) adds independent risk. It does not change TG\:HDL, but it influences your overall strategy.
- Imaging when risk is uncertain. If you are middle-aged or older with borderline or conflicting risk signals, coronary artery calcium can clarify near-term risk and treatment intensity; see our guide to coronary calcium scanning for who benefits.
Treatment conversations shaped by the bundle
- High ApoB with high TG\:HDL: Prioritize LDL/ApoB lowering (statin foundational; add-ons such as ezetimibe, PCSK9 inhibitor, or bempedoic acid as indicated). Concurrently fix triglyceride drivers (diet pattern, weight, glycemic control, alcohol). Prescription EPA or fibrate may be appropriate for persistent triglyceride elevation after LDL/ApoB are addressed.
- Normal ApoB with high TG\:HDL: Emphasize insulin sensitization and lifestyle levers; consider agents that lower triglycerides and improve metabolic health if lifestyle alone stalls.
- Very high triglycerides (≥500 mg/dL): Protect against pancreatitis first. A fasting confirmation and targeted therapy are indicated; secondary causes must be investigated promptly.
What “success” looks like
- Over quarters, the ratio falls as triglycerides decline and HDL steadies or rises slightly.
- ApoB reaches the agreed target for your risk level.
- Glucose metrics (A1c, fasting insulin) normalize and stay there.
If uncertainty remains high—particularly when family history, Lp(a), or imaging suggest elevated risk—escalate prevention despite a “reasonable” TG\:HDL ratio. The ratio is a signal, not a veto.
References
- Triglyceride to high-density lipoprotein cholesterol ratio and cardiovascular events in the general population: A systematic review and meta-analysis of cohort studies (2022)
- Unraveling the controversy between fasting and nonfasting lipid testing in a normal population: a systematic review and meta-analysis of 244,665 participants (2024) (Systematic Review)
- The difference between fasting and non-fasting lipid measurements is not related to statin treatment (2021)
- APOLIPOPROTEIN B: Bridging the gap between evidence and clinical practice (2025) (Review)
- 2021 ACC Expert Consensus Decision Pathway on the Management of ASCVD Risk Reduction in Patients With Persistent Hypertriglyceridemia (2021) (Guideline)
Disclaimer
This article is educational and does not replace personalized medical advice. Decisions about testing and treatment should be made with a qualified clinician who can consider your history, medications, and current health status. If your lipids or glucose are significantly abnormal, or you have symptoms suggestive of cardiovascular disease, seek medical care promptly.
If you found this helpful, consider sharing it with a colleague or on your preferred social platform (e.g., Facebook or X). Your support helps us continue producing careful, evidence-guided content.


