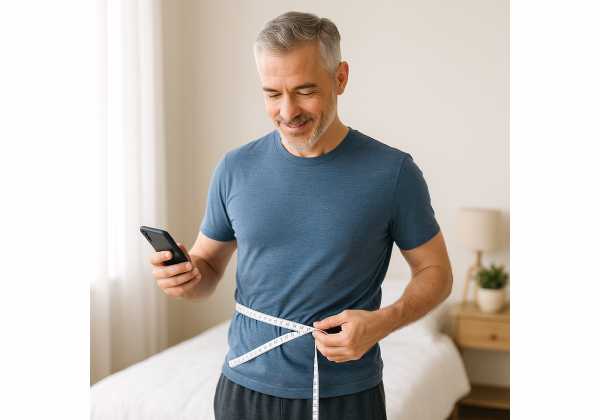
A tape measure and a few minutes are enough to track two of the most useful markers of central fat: waist circumference and waist-to-height ratio (WHtR). These at-home checks don’t replace a clinician’s evaluation, but they do signal trends that map closely to metabolic and cardiovascular risk. This guide shows you how to measure your waist correctly, interpret your WHtR, and build a simple, repeatable routine that makes numbers meaningful. You will learn how to pair measurements with photos, clothing fit, and other trackers to see progress from many angles—without obsessing over the scale. If you want to go deeper on related testing and tools, see our concise overview of biomarkers and tools for longevity. Done well, this monthly ritual takes less than five minutes and pays off with clearer decisions about habits, training, and follow-up.
Table of Contents
- How to Measure Waist Accurately: Landmarks and Tape Tension
- Waist-to-Height Ratio: Why It Tracks Risk Well
- Setting Up a Repeatable Monthly Check
- Photos, Logs, and Clothing Fit as Supporting Measures
- Common Errors: Sucking In, Clothing, and Posture
- When Numbers Suggest Clinical Follow-Up
- Pairing Measurements with Other Trackers (BP, Steps)
How to Measure Waist Accurately: Landmarks and Tape Tension
Getting a reliable waist measurement starts with using the same anatomical landmarks and tape tension every time. Small inconsistencies—measuring over thick clothing, pulling the tape too tight, or shifting the tape up or down—can move the number by several centimeters. The aim is consistency, not perfection.
Landmarks (choose one and stick with it):
- WHO midpoint method (recommended for home use): Stand relaxed. Find the lower margin of your last palpable rib and the top of your hip bone (iliac crest). Place the tape horizontally at the midpoint between these two points.
- Iliac crest method (common in U.S. clinics): Place the tape at the top edge of the iliac crest and keep it level around the abdomen.
Either method is valid, but switching between them changes the reading. Pick one method now and write it into your routine so you never need to guess later.
Tape choice and tension:
- Use a non-stretch flexible tape. If available, a constant-tension (Gulick-style) tape helps standardize pull.
- If you do not have a tensioned tape, pull the tape snug to the skin without compressing soft tissue—you should be able to slide a finger under the tape.
Measurement posture and timing:
- Empty your bladder.
- Stand tall with feet hip-width apart, weight evenly distributed, arms relaxed at your sides.
- Breathe normally for a few cycles, then measure at the end of a gentle exhale (not a forced blow).
- Keep the tape parallel to the floor all the way around, crossing the navel area without using the navel as the landmark.
- Read to the nearest 0.1 cm (or 1/8 inch) without leaning down—use a mirror if needed.
Repeatability tips:
- Take two measurements. If they differ by more than 1 cm, take a third and use the average of the two closest readings.
- Measure on bare skin or over very thin, smooth clothing to avoid bulk.
- Record the method (WHO midpoint or iliac crest), time of day, and tape type in your log.
Special situations:
- Pregnancy, recent abdominal surgery, or significant bloating: skip or defer.
- Hernias or stomas: consult your clinician for a modified site and method.
When you control the “where” and the “how,” your waist number becomes a genuine signal—one you can trust month after month.
Waist-to-Height Ratio: Why It Tracks Risk Well
Waist-to-height ratio (WHtR) is a simple fraction: waist circumference ÷ height, using the same units. If your waist is 86 cm and your height is 172 cm, your WHtR is 0.50. This ratio adjusts waist size for stature and focuses on central fat—the metabolically active depot most linked to insulin resistance, hypertension, dyslipidemia, and fatty liver. Unlike BMI, WHtR does not confuse muscularity with adiposity and is less sensitive to sex and ethnicity differences, making it practical for self-monitoring and population screening.
How to classify adult WHtR (for most people with BMI below 35 kg/m²):
- 0.40–0.49: generally no increased risk.
- 0.50–0.59: increased risk; consider targeted lifestyle changes and risk review.
- ≥0.60: high risk; speak with your clinician and check other cardiometabolic markers.
These categories align with contemporary guidance and reflect a large body of evidence comparing WHtR with BMI and raw waist circumference for identifying cardiometabolic risk. They also echo the straightforward public message many clinicians favor: “Keep your waist under half your height.” That single rule translates well across adults of different statures and body frames.
Why WHtR outperforms BMI in many contexts:
- Targets visceral fat: Central adiposity drives risk more than total body mass.
- Accounts for stature: A 90-cm waist carries different implications for someone 150 cm tall versus 190 cm tall; the ratio normalizes this.
- Works across groups: While no single cut-point fits everyone perfectly, WHtR tends to perform consistently across sexes and ethnicities, especially around the 0.5 boundary in non-athletic adults.
Practical takeaways:
- If your WHtR is 0.50–0.59, combine habit adjustments (protein-forward meals, fiber to ≥25–30 g/day, daily movement with two or more resistance sessions weekly) and re-check monthly.
- If your WHtR is ≥0.60, add a clinician visit to review blood pressure, fasting lipids, glucose/insulin markers, and liver enzymes, and to discuss weight-management options.
For another simple, complementary signal you can track from routine labs, see our guide to the triglycerides to HDL ratio. Together, WHtR and TG\:HDL highlight central fat and insulin resistance patterns from two angles—tape and blood.
Setting Up a Repeatable Monthly Check
You can build a five-minute ritual that delivers reliable data without micromanaging daily fluctuations. The secret is standardization—make the environment, timing, and method as identical as possible each month.
Your monthly protocol (save this in your notes):
- Timing: Choose the same day each month, in the morning after using the bathroom, before breakfast and before workouts.
- Preparation: Remove belts and thick clothing. If you measure over clothing, use the same thin layer every time.
- Measure height quarterly: Height is stable in adults but may change subtly; confirm every 3–6 months (barefoot, wall-mounted stadiometer or a careful wall-mark method).
- Waist method: Use WHO midpoint (or your chosen method) and log it explicitly so future you remembers what you did.
- Readings: Take two waist readings (three if needed) and record to the nearest 0.1 cm. Average the two closest.
- Calculate WHtR: Divide waist by height in the same units. Record to two decimals (e.g., 0.52).
- Context notes: In one line, jot changes that matter: travel, illness, medications, menstrual phase, unusual training blocks, or diet shifts.
A simple log template:
- Date / Time
- Method (WHO midpoint or iliac crest; tape type)
- Waist (cm) — measurements 1–2 (3 if needed) and average
- Height (cm) (update quarterly)
- WHtR
- Notes (sleep, training, travel, diet phase)
How often should you check?
- Monthly is usually best: it’s frequent enough to catch trends, but spaced enough to avoid noise from day-to-day variation.
- Consider twice monthly if you are running a tight intervention (e.g., pre-op weight loss, specific athletic goals) and can keep the conditions identical.
What if the scale disagrees with the tape?
- Prioritize the waist trend over short-term weight swings. Glycogen shifts, sodium, and menstrual cycles can move weight by 1–3 kg with little change in central fat.
- To round out body changes, learn how different body composition methods compare in our guide to body composition methods.
With a cadence and checklist you trust, your monthly check becomes effortless—signal up, noise down.
Photos, Logs, and Clothing Fit as Supporting Measures
Numbers are powerful, but they gain meaning when you pair them with visual and lived cues. Photos and clothing fit reduce the chance that lighting, posture, or mood will fool you into misreading progress. They also capture body shape change that a scale may miss when fat down and muscle up cancel each other out.
Progress photos (two minutes, once a month):
- Setup: Same spot, time, and lighting. Use a neutral background and a phone tripod or a chair at chest height.
- Clothing: Fitted shorts (and sports top if relevant) so waist contours are visible.
- Angles: Front, side, and three-quarter view. Stand tall, relax your abdomen, and look forward.
- Framing: From mid-thigh to above the shoulders to keep scale consistent.
- Notes: Add a quick caption with the waist average and WHtR for that day.
Clothing fit (“reference garment” method):
- Pick one pair of pants or a skirt that used to fit perfectly. Label it (e.g., “Reference Jeans”).
- Once a month, put them on at the end of your measurement session and rate fit on a 1–5 scale: (1) very tight, (3) snug, (5) loose.
- Over time, this qualitative score correlates well with waist changes—especially across the 0.50 to 0.60 WHtR range.
Habit and energy logs:
- Add a weekly one-line entry: sleep hours, step average, resistance sessions, and a quick energy rating.
- These short notes often explain plateaus (travel week, injury) and highlight what works (extra fiber, earlier dinners).
Wearable tie-ins (optional):
- If you already track resting heart rate and heart rate variability, note the weekly averages alongside waist trends. Improvements in recovery often precede visible body changes. Learn the basics in our guide to resting heart rate and HRV.
Why this works:
- Photos and clothing bring face validity to technical metrics.
- Combining quantitative (waist, WHtR) with qualitative (fit, photos) closes the loop between numbers and daily life.
- You build intrinsic motivation by seeing real-world changes—not just spreadsheet deltas.
Over months, this supporting trio—photos, logs, clothing—turns your waist data into a clear narrative you can act on.
Common Errors: Sucking In, Clothing, and Posture
Most measurement errors are predictable—and fixable. Audit your routine against the list below and you will eliminate the big sources of drift.
Top errors to avoid:
- Sucking in or bracing the core. Even subtle abdominal tension can shrink the reading several centimeters. Breathe normally and measure at the end of a calm exhale.
- Shifting landmarks. The navel is not the landmark; use the WHO midpoint or the iliac crest method and never switch without annotating your log.
- Tape at an angle. The tape must stay horizontal. A tilted tape overestimates on one side and underestimates on the other.
- Measuring over bulky clothing. A thick waistband or sweatshirt can add 1–2 cm. If you must measure over clothing, use the same thin layer each time and note it.
- Over-tightening the tape. Compressing soft tissue makes numbers look better but ruins comparability. Aim for snug, not strangled.
- Leaning to read the tape. Leaning flexes the trunk and shortens the circumference. Use a mirror or mark the tape before removing it.
- Inconsistent timing. Afternoon sodium, hydration, or a large meal can inflate waist temporarily. Morning, pre-breakfast wins for repeatability.
- Rounding aggressively. Always read to 0.1 cm (or the smallest realistic increment) and average two close readings.
If your number jumps unexpectedly:
- Re-measure after three calm breaths.
- Confirm the landmark and tape level.
- Check your notes for meals, hydration, and bowel habits that could explain a one-off rise.
- If uncertainty remains, repeat the protocol the next morning and compare.
Build skills by analogy:
The habits that yield accurate waist readings mirror those for reliable home blood pressure (quiet room, proper positioning, repeated measures, written notes). If you are building a broader home-monitoring routine, review our concise primer on home blood pressure technique; the same discipline applies here.
Measure cleanly, write it down, and let trends—not single numbers—drive your decisions.
When Numbers Suggest Clinical Follow-Up
Self-measurement is a great first step, but certain numbers and patterns should prompt a conversation with your clinician. Use the guideposts below as triggers for assessment rather than diagnoses.
Waist-to-height ratio triggers (adults with BMI under ~35 kg/m²):
- WHtR 0.50–0.59: Plan lifestyle changes and request a basic metabolic risk screen at your next visit (blood pressure, fasting lipids, fasting glucose or A1c, and liver enzymes).
- WHtR ≥0.60: Schedule an appointment in the near term to review blood pressure, glucose/insulin measures, lipids, and to discuss structured weight-management options. Ask about screening for fatty liver and other obesity-related conditions.
Waist circumference thresholds commonly used in practice:
- U.S. ATP III–style criteria: increased risk at ≥102 cm (men) and ≥88 cm (women).
- International/ethnicity-aware thresholds: lower cut points are often used for central adiposity—e.g., ≥94 cm (European men), ≥90 cm (many South and East Asian men), and ≥80 cm (women in these groups).
If your readings cluster near or above these ranges, discuss them with a clinician who can interpret them in context (age, sex, ancestry, fitness, medications).
Patterns that elevate concern beyond a single reading:
- Upward trend: a ≥4–5 cm rise in waist over 6–12 months, or WHtR crossing 0.50 → 0.60 even if BMI changes little.
- Discordant metrics: normal BMI but high WHtR (central adiposity) or normal weight with high blood pressure or triglycerides.
- Symptoms or comorbidities: snoring/daytime sleepiness (sleep apnea risk), elevated resting heart rate, fatigue with exertion, or right-upper-quadrant discomfort.
What to ask for at the visit:
- A blood pressure review (including ambulatory or home monitoring if clinic readings are borderline).
- Fasting lipids emphasizing non-HDL cholesterol or ApoB, A1c and/or fasting glucose, and, if indicated, fasting insulin.
- Liver assessment if central adiposity rises or WHtR is high: ALT, AST, and a simple fibrosis score (e.g., FIB-4) with ultrasound if needed. For a quick primer, see our overview of NAFLD screening basics.
- A discussion of weight-management options tailored to your risk and preferences, which may include nutrition strategies, resistance training, medications, or referral to a specialist.
Special populations:
- Older adults: modestly higher WHtR may coexist with preserved function; judge numbers alongside strength, gait speed, and clinical history.
- Athletes/high muscle mass: waist remains informative; combine it with performance, recovery markers, and selective labs rather than BMI alone.
- Pregnancy: defer waist/WHtR and use clinician-guided metrics.
Numbers are a start; interpretation in your medical context is the finish. Treat your tape measure as an early-warning system that helps you and your clinician decide what to check next.
Pairing Measurements with Other Trackers (BP, Steps)
Waist and WHtR shine when you combine them with a few low-effort trackers. Together they create a multidimensional picture of health momentum—useful for both prevention and course-correction.
Blood pressure (BP):
- Central fat and vascular tone move together. If your WHtR rises into the 0.50–0.59 zone, start home BP monitoring for two weeks: mornings and evenings, two readings per session, seated, arm supported, validated cuff.
- Look for an average <120/80 mmHg. If your average is ≥130/80 mmHg, discuss lifestyle and monitoring cadence with your clinician.
- Re-check BP after meaningful changes in waist (e.g., 3–5 cm loss or gain), new medications, or training blocks.
Daily steps and activity minutes:
- Use steps as a floor (e.g., a personalized minimum such as 7,000–9,000 per day) and structured exercise as the ceiling (two to four resistance sessions plus vigorous minutes if appropriate).
- When a plateau hits, test one lever at a time: increase daily steps by 1,000–2,000 or add a third brief resistance session. Watch your waist trend over the next month.
Protein and fiber anchors:
- Most adults do better with 1.2–1.6 g/kg/day protein distributed across meals and ≥25–30 g/day fiber from plants. These anchors improve satiety and help preserve or build lean mass while waist shrinks.
Sleep and recovery basics:
- Short sleep raises appetite and impairs insulin sensitivity. If your WHtR stalls, review bedtime, total sleep time, and caffeine/alcohol timing.
- Consider light morning light exposure, earlier dinners, and consistent wind-down to support better sleep—often the hidden driver of body-composition change.
Putting it together (a one-page dashboard):
- Monthly: waist (avg), WHtR, reference-garment fit score, three photos.
- Weekly: BP averages (if elevated previously), step average, training sessions, sleep hours, protein/fiber notes.
- Quarterly: height check, lab review (if indicated), goal refresh.
When you treat waist and WHtR as the spine of your self-monitoring—and plug in BP, steps, and a few habit anchors—you get a clear, sustainable system that nudges decisions in the right direction.
References
- Identifying and assessing overweight, obesity and central adiposity | Overweight and obesity management | Guidance | NICE (2025)
- Waist circumference and waist-hip ratio: report of a WHO expert consultation (2011)
- Obesity and Cardiovascular Disease: A Scientific Statement From the American Heart Association (2021) (Guideline)
- Diagnostic Accuracy of Waist-to-Height Ratio, Waist Circumference, and Body Mass Index in Identifying Metabolic Syndrome and Its Components in Older Adults: A Systematic Review and Meta-Analysis (2023) (Systematic Review)
- Waist Circumference Measurement Methodology Study: National Health and Nutrition Examination Survey, 2016 (2018)
Disclaimer
This article provides general educational information and is not a substitute for professional medical advice, diagnosis, or treatment. Always consult a qualified healthcare professional with questions about your health, medical conditions, or changes to your diet, exercise, or medications. Never ignore or delay seeking medical advice because of something you have read here.
If you found this guide useful, please consider sharing it on Facebook, X, or your preferred platform, and follow us for future updates. Your support helps us keep producing clear, evidence-based content.


