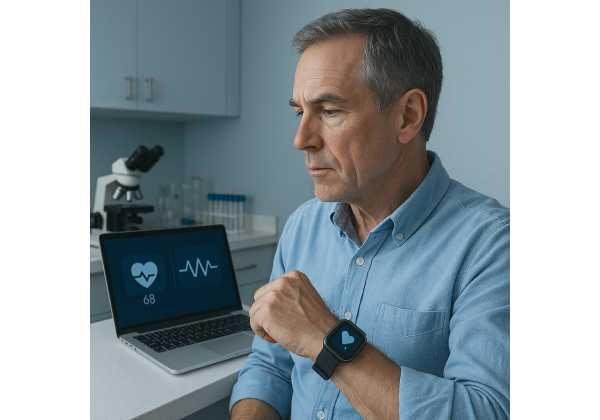
A long healthspan depends on daily choices that compound over years. Two metrics can help you steer: resting heart rate (RHR), the number of beats per minute when you are truly at rest, and heart rate variability (HRV), the beat-to-beat variation that reflects your nervous system’s balance. Both respond to sleep, training, illness, alcohol, and stress—often before you feel different. The goal is not to chase a single “perfect” number but to understand your baseline and watch how it shifts. In this guide, you will learn how to set up reliable morning readings, interpret patterns, filter out noise, and turn trends into action. If you want to expand your longevity toolkit beyond RHR and HRV, see our broader coverage of biomarkers and tools for longevity.
Table of Contents
- Setting Up: Morning Readings, Straps vs Watches, and Apps
- What RHR and HRV Reflect and Why Trends Beat Single Values
- Artifacts and Noise: Movement, Alcohol, and Illness
- Weekly Review: Baseline, Rolling Averages, and Flags
- When Numbers Suggest Rest, Stress, or Medical Review
- Data Hygiene: Consistent Timing and Device Calibration
- Exporting and Storing Your Data
Setting Up: Morning Readings, Straps vs Watches, and Apps
Why morning readings? After a full night’s sleep—before caffeine, emails, or movement—your physiology is at its calmest and most repeatable. That’s the best time to measure RHR and HRV. This keeps posture, temperature, circadian phase, hydration, and emotional load as constant as possible.
Devices, at a glance
- Chest-strap ECG sensors (e.g., sport chest straps) record electrical signals and provide robust R-R intervals. They’re the reference for short recordings (1–5 minutes) and interval-level HRV metrics like RMSSD and SDNN.
- Wrist wearables and rings use photoplethysmography (PPG) to infer beats from blood-volume changes. Modern hardware and firmware are accurate at rest and during sleep for RHR and nightly HRV summaries. Motion, cold skin, and poor fit degrade quality.
- Smartphone camera apps can estimate HR and sometimes HRV using finger PPG. Quality varies; they’re convenient but more sensitive to pressure and lighting.
Practical setup
- Choose your mode:
- Nightly automatic (sleep session): effortless and good for trend-tracking.
- Morning spot check: 60–300 seconds, supine, breathing normally. Avoid paced breathing unless it’s your standardized protocol every day.
- Position and environment:
- Supine (on your back) on the same mattress or surface.
- Room temperature you can maintain daily.
- Hands warm; cold fingers impair PPG.
- Duration and metrics:
- HRV: Record at least 2–5 minutes for stable RMSSD or SDNN. Ultra-short (30–60 s) readings can approximate, but they’re less reliable for decision-making.
- RHR: Use the lowest stable value from the session or the device’s nightly resting value.
- Breathing:
- Breathe normally. If you use paced breathing, keep the same rate daily (e.g., 6–8 breaths/min), and note that this standardizes vagal influence, which can help reduce day-to-day noise.
- Consistency:
- Measure at the same time each morning, after waking and bathroom, before food, fluids, or screens.
- Use the same device and app to avoid mixing algorithms.
Quick troubleshooting
- Spikes or zeros in HRV often reflect missed beats or mistracking. Re-record a single 2–5 minute session rather than repeating many times; fatigue and arousal creep in.
- Unusual RHR? Confirm the session was calm and artifact-free. If you had a restless night, rely on the nightly RHR rather than a single morning spot check.
Outcome: a repeatable morning routine, one device, one metric set, and a stable context so your trends mean something.
What RHR and HRV Reflect and Why Trends Beat Single Values
Resting heart rate (RHR) mainly reflects the tug-of-war between sympathetic (“go”) and parasympathetic (“rest-and-digest”) inputs to your heart, plus fitness, temperature, hydration, and hormones. Lower RHR often tracks with higher aerobic fitness and better sleep. Higher RHR tends to rise with stress, illness, overreaching, fever, dehydration, and stimulant use.
Heart rate variability (HRV) is the variability in time between beats (not the beats per minute). Two practical metrics:
- RMSSD (ms): Short-term variability driven by parasympathetic (vagal) activity. It’s the go-to daily metric for athletes and non-athletes alike.
- SDNN (ms): Overall variability across the session; better for longer recordings (≥5 minutes) and 24-hour Holter analyses.
Because genetics, age, and sex influence absolute HRV levels, comparing your number to someone else’s is rarely useful. Your baseline—the range you typically see when healthy and well-recovered—matters most. Think in trends:
- RHR trend: A persistent rise of ~3–5 bpm above your usual low for several days often points to accumulated stressors or brewing illness. A single day spike is less informative.
- HRV trend: A sustained drop in RMSSD (for example, 10–20% below your rolling baseline for 3+ days) may indicate that recovery is lagging. One low day after a hard workout can be normal.
Context beats absolutes
- A modest RHR uptick paired with stable HRV may simply reflect heat, altitude, or mild dehydration.
- A sharp HRV drop with normal RHR can occur with poor sleep or acute psychological stress.
- Both worse (RHR up, HRV down) for several days suggests an actionable load mismatch or illness.
Sleep profoundly shapes both metrics. If you want to go deeper on device strengths and sleep-stage estimates, see our primer on sleep wearables.
Bottom line: Treat RHR and HRV as early-warning signals and course-correction guides, not scores to “win.” String together small, consistent behaviors and let the trendlines confirm you’re on track.
Artifacts and Noise: Movement, Alcohol, and Illness
RHR and HRV are sensitive. To trust your trends, you must recognize—and reduce—noise.
Common distorters
- Movement: Rolling or fidgeting during a measurement adds missed or extra beats. With PPG, even micro-movements can introduce false intervals. Stay still; keep the strap snug or the ring/wrist device comfortably tight.
- Breathing patterns: Sighs, breath holds, or deliberate slow breathing can over- or under-state HRV. Use natural breathing unless your daily protocol purposely includes paced breathing at the same rate every day.
- Temperature and perfusion: Cold hands or a chilled room reduce PPG signal quality; warm up your hands and keep conditions stable.
- Alcohol: Even one to two drinks can raise RHR and lower HRV that night and the next morning. A heavy evening out often depresses HRV for 24–72 hours.
- Caffeine and late exercise: Caffeine later in the day and late high-intensity training can elevate nocturnal RHR and suppress HRV.
- Illness and allergies: Fever, infection, and inflammatory flares commonly drive RHR up and HRV down before symptoms peak.
How to spot bad data
- Impossible swings: RMSSD of 160 ms one day and 10 ms the next—without a clear cause—often signals artifacts.
- Flat-lined HRV or zero values: Indicates tracking failure; exclude the session.
- Wildly variable RHR within one short session: Redo the measurement after resting quietly for 2–3 minutes.
Data triage rules
- Mark confounders (alcohol, illness, red-eye flights, hard evening workouts).
- Exclude only clearly bad sessions. Do not over-curate; selective deletion biases trends.
- Use rolling averages (see next section) to smooth normal variability without masking meaningful shifts.
HRV is also influenced by systemic inflammation. If you are investigating persistent fatigue, poor recovery, or unrefreshing sleep, pairing HRV trends with simple inflammation markers can clarify the picture. See our guide to inflammation markers for what to order and how to interpret patterns over time.
Takeaway: Most “mysterious” HRV dips and RHR spikes have plain causes—movement, alcohol, poor sleep, or early illness. Log these inputs and your trendlines will make sense.
Weekly Review: Baseline, Rolling Averages, and Flags
A single morning is noisy; a week is a signal. Build a simple review rhythm.
Step 1: Establish your baseline (first 3–4 weeks)
- Record a daily morning HRV (RMSSD) and RHR under consistent conditions.
- Compute a 7-day rolling average for each. This smooths normal day-to-day wobble while keeping responsiveness.
- Note context: training load, sleep duration/quality, alcohol, travel, illness, menstrual phase (if applicable).
Step 2: Track weekly changes
- Green zone: RHR within ~±2 bpm of your average and RMSSD within ~±10% of baseline.
- Yellow zone: RHR ↑ ~3–5 bpm or RMSSD ↓ ~10–20% for ≥2–3 days. Consider extra recovery, earlier bedtime, hydration, and lower intensity.
- Red zone: RHR ↑ ≥5–7 bpm and RMSSD ↓ ≥20–30% for ≥3 days, or any acute spike with symptoms (fever, chest discomfort, dizziness). Scale back training; prioritize sleep; if symptoms persist or are concerning, seek medical advice.
Step 3: Link actions to signals
When a yellow or red flag appears, choose one lever for 3–7 days and watch whether trends normalize:
- Sleep: Add 30–60 minutes in bed, anchor wake time, and dim screens earlier.
- Training: Reduce intensity/volume by 20–40% or swap a hard day for easy aerobic movement.
- Hydration/nutrition: Eat a balanced dinner earlier; reduce alcohol; maintain electrolytes during heavy training or heat.
- Stress: 10 minutes of unforced breathwork or a quiet walk after lunch may help HRV rebound.
Step 4: Review in context
- Combine 7-day and 28-day rolling views. The 7-day view guides near-term decisions; the 28-day view confirms direction.
- Seasonal factors (heat, pollen) and life events (deadlines, travel) explain many shifts—log them.
Blood pressure also interacts with autonomic status and fitness. If you are building a weekly recovery and risk picture, consider pairing these trends with structured home blood pressure tracking. Our tutorial on home blood pressure covers proper technique and targets so your numbers are truly comparable.
Goal: Use a light weekly check-in—10 minutes, same time each week—to keep micro-corrections easy and avoid overreacting to one odd morning.
When Numbers Suggest Rest, Stress, or Medical Review
Numbers should drive proportionate actions. Use the following decision helpers:
Likely need for extra recovery
- After a hard block of training or heavy travel: RHR up ~3–5 bpm and RMSSD down ~10–25% for 2–3 days, with normal appetite and mood.
Action: An easy day or two, extra sleep, hydration, light mobility. If trends normalize, resume plan.
Likely acute stress or poor sleep
- RMSSD drop ≥15–30% with little RHR change, plus subjective stress, short sleep, or late caffeine.
Action: Prioritize a calm evening, reduce intensity, short daytime “off-switch” breaks, earlier wind-down. Expect rebound within 24–72 hours.
Likely illness brewing
- RHR jump ≥5–7 bpm and RMSSD drop ≥20% lasting 3+ days, especially with fatigue, sore throat, fever, or congestion.
Action: Rest, hydration, conservative training; consider antigen/flu tests depending on season and exposures.
When to consider medical review promptly
- New chest pain, pressure, or unusual shortness of breath at rest.
- Sustained RHR >100 bpm at rest (not explained by fever, dehydration, or medications).
- Unexplained palpitations or irregular pulse readings, especially if recurrent.
- Syncope (fainting) or near-syncope.
- RHR trend climbing steadily for weeks without clear triggers, or persistently low HRV with symptoms like dizziness, intolerance to standing, or exhausted sleep.
Finally, autonomic and metabolic health are strongly intertwined. If your RHR is chronically high and HRV low, it is worth assessing glucose regulation (fasting glucose, fasting insulin, A1c) and nutrition. Our guide to glucose and insulin markers can help you interpret lab results and decide on next steps with a clinician.
Principle: Let symptoms and safety trump any wearable readout. RHR and HRV are helpful guides, not diagnostic tools.
Data Hygiene: Consistent Timing and Device Calibration
Clean inputs produce useful trends. Most misunderstandings trace back to sloppy measurement habits or mixing methods.
Timing and posture
- Same time every morning. After waking, bathroom break, then 2–5 minutes supine.
- If you sometimes measure seated or standing, keep it consistent on those days and label the posture. Standing HRV is naturally lower; do not compare it to supine baselines.
Device consistency
- Use one device for your daily trend. Different brands and even firmware versions use distinct algorithms, artifact detection, and rounding.
- If you replace a device, create a two-week overlap: measure with both each morning, then set a new baseline with the new device.
Calibration mindset
- While consumer devices don’t require “calibration” like lab equipment, you can validate them for your use:
- Compare a few calm morning sessions against a trusted chest-strap ECG.
- Check that back-to-back 5-minute readings under identical conditions are similar (within a few bpm for RHR and within ~5–10 ms for RMSSD).
- Keep firm but comfortable contact (strap snug at the sternum; ring/wrist device snug but not constricting).
Label confounders
- Add simple tags: “alcohol 2,” “late HIIT,” “red-eye,” “sick,” “fever,” “menses day 1,” “heat wave.” These labels turn anomalies into understandable events at review time.
Managing health data shares principles with glucose telemetry: consistent timing, device familiarity, and context notes. For tips on setup discipline and avoiding over-interpretation with sensors, scan our primer on CGM setup and calibration.
Key habit: Protect one quiet, repeatable minute in your morning. The single best upgrade to your data is a stable routine.
Exporting and Storing Your Data
Your data gains value when it is accessible, portable, and backed up. A simple system lets you keep history through device upgrades and share summaries with a clinician or coach when needed.
Choose a home for your data
- Spreadsheet or notebook app: Easy and flexible. Track date, RHR, RMSSD, sleep hours, training load, alcohol, illness, and a comment field.
- Health platforms: Many devices sync to a central hub, letting you export CSV files with timestamps.
- Privacy-forward options: If you prefer local control, export weekly to a folder in your cloud drive and an external hard drive.
Export cadence
- Weekly: Export CSV from your wearable app and append to your master sheet.
- Monthly: Snapshot charts (7-day and 28-day rolling averages for RHR and RMSSD) and a one-paragraph summary: “What improved, what suffered, suspected causes.”
Versioning and continuity
- When you change devices, keep a note of the overlap period and the date you reset baselines. Store the final two weeks from your old device and the first two weeks from the new device in the same file, clearly labeled.
Sharing with your care team
- For a time-pressed appointment, send a single-page PDF with:
- 28-day rolling charts for RHR and RMSSD
- A bullet list of medications/supplements
- A note on sleep, training, and major stressors
- Any red-flag symptoms (e.g., syncope, chest discomfort)
Security basics
- Use strong, unique passwords for device accounts.
- Review app privacy settings; disable unnecessary data sharing.
- Back up exports to two locations (cloud and external drive).
Essentials: Keep it simple, repeatable, and private. Your future self—and your clinician—will thank you for clean, continuous records.
References
- ESC working group on e-cardiology position paper: use of commercially available wearable technology for heart rate and activity tracking in primary and secondary cardiovascular prevention—in collaboration with the European Heart Rhythm Association, European Association of Preventive Cardiology, Association of Cardiovascular Nursing and Allied Professionals, Patient Forum, and the Digital Health Committee 2021 (Position Paper)
- Heart Rate Variability Measurement through a Smart Wearable Device: Another Breakthrough for Personal Health Monitoring? 2023 (Review)
- Effects of sleep deprivation on heart rate variability: a systematic review and meta-analysis 2025 (Systematic Review)
- Resting heart rate and all-cause and cardiovascular mortality in the general population: a meta-analysis 2016 (Systematic Review)
- Heart rate variability: standards of measurement, physiological interpretation and clinical use 1996 (Guideline)
Disclaimer
This article provides general educational information on resting heart rate and heart rate variability for healthy aging. It is not a substitute for professional medical advice, diagnosis, or treatment. Always seek the guidance of your physician or other qualified health provider with any questions about your health, symptoms, or a medical condition. Never disregard or delay seeking professional advice because of something you read here.
If you found this article useful, please consider sharing it with a friend or on your favorite platform (Facebook, X, or elsewhere), and follow us for future updates. Your support helps us continue creating clear, evidence-informed content.


