Modern wearables promise lab-like sleep insights from your wrist, finger, or mattress. They are useful—but imperfect—tools. Understanding what these devices actually sense (movement, heart rhythm, skin temperature) and how algorithms translate signals into sleep estimates can help you focus on metrics that matter for healthspan. In this guide, you will learn which numbers to trust, how to collect cleaner data, and when a medical sleep study is the right next step. If you track other longevity markers, it helps to place sleep data alongside them; see our concise primer on building a practical longevity testing toolkit to keep everything in one system. The goal is not to chase a higher “sleep score.” It is to build steady routines that improve energy, mood, cardiometabolic risk, and recovery—without turning bedtime into a project.
Table of Contents
- What Wearables Estimate vs What They Truly Measure
- Total Sleep Time and Regularity: High-Value Metrics
- Sleep Staging: Why It’s Approximate (and How to Use It)
- Improving Accuracy: Placement, Settings, and Charging Habits
- Orthosomnia: Avoiding Obsession with Sleep Scores
- When to Seek a Clinical Sleep Study
- Making a Simple Weekly Sleep Dashboard
What Wearables Estimate vs What They Truly Measure
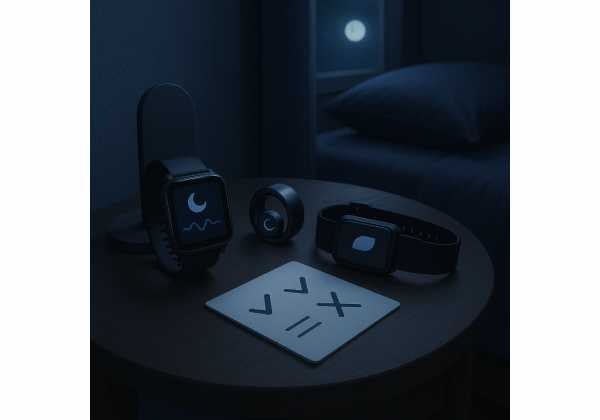
Most consumer devices do not “see” brainwaves. Instead, they infer sleep from sensors:
- Accelerometer and gyroscope detect motion and posture.
- Photoplethysmography (PPG) measures changes in blood volume at the skin to estimate heart rate and heart rate variability (HRV).
- Skin temperature and optical SpO₂ (on some models) add context about circadian rhythm and breathing.
- Microphone, pressure, or radar (in contactless or “under-mattress” systems) capture breathing and movement patterns without being worn.
From these signals, algorithms estimate sleep-wake state and sleep stages. That distinction matters. “Measured” signals are raw and continuous; staged sleep (light, deep, REM) is a model, trained on datasets where machine outputs are matched to clinician-scored polysomnography (PSG). Because training sets, firmware, and software change over time, the same device can behave differently after an update.
Here’s what that means for reliability in everyday use:
- Total sleep time (TST) is usually the most dependable metric on modern wearables. When you lie still and cardiovascular signals slow, algorithms classify “asleep.” The main failure mode is quiet wakefulness being mislabeled as light sleep, which slightly overestimates TST in insomnia or fragmented nights.
- Sleep timing (bedtime, wake time, mid-sleep, regularity) is also robust because it relies on larger patterns rather than moment-to-moment staging. Day-to-day consistency is a meaningful signal for circadian health and next-day function.
- Sleep stages are approximate. Devices infer stages from movement plus autonomic patterns (heart rate and HRV). They can capture trends but are not interchangeable with EEG-based staging. Treat stage minutes as directional, not diagnostic.
- Respiratory metrics (respiratory rate, “disturbances,” snore detection) vary by hardware. Watches and rings derive breathing indirectly from PPG; under-mattress pads and radar devices estimate respiratory motion. Treat nightly changes as hints, not diagnoses.
- Readiness or sleep “scores” bundle multiple inputs (duration, timing, efficiency, temperature deviation, HRV). They are helpful for triage—good, fair, poor—but can mask which single input needs attention.
Practical implications:
- Use wearables to enforce consistent lights-out and rise times, and to verify that your sleep opportunity is long enough.
- Use trends (multiweek averages) rather than reacting to one night.
- Keep expectations realistic: a consumer device is an early-warning system, not a clinical test.
Total Sleep Time and Regularity: High-Value Metrics
If you focus on only two numbers, choose total sleep time and sleep regularity.
Total sleep time (TST). Most adults function best on 7–9 hours of sleep opportunity, yielding ~7–8 hours of actual sleep. Wearable TST tends to be directionally accurate and improves with consistent bed and wake times. The traps are long time-in-bed with long awakenings (overestimation) and highly irregular schedules (noisy averages).
Regularity. Going to bed and waking within a ~60-minute window on most days strengthens your circadian rhythm, stabilizes hormones, and improves daylight alertness. Several large device-based cohorts show that regular timing correlates with lower cardiometabolic risk and mortality, independent of duration. For personal use, you do not need a formal “sleep regularity index.” A simple method works:
- Pick a target sleep window that you can keep 5–6 days per week (e.g., 10:30 p.m.–6:30 a.m.).
- Track the mid-sleep point (halfway between sleep onset and wake time). Keep most days within ±45 minutes of your baseline mid-sleep.
- Use a 7-day rolling average of bedtime, wake time, and TST. If the average TST dips >30 minutes below your baseline for two consecutive weeks, treat it as a sign to reduce late-night work, alcohol, or unplanned naps.
Why these metrics are “high value”:
- They’re actionable. You can directly manipulate schedule and opportunity.
- They’re robust to staging errors. You do not need perfect classification to know if you slept long enough or consistently.
- They translate to energy and performance quickly. Most people feel changes within a week of steady timing and a longer sleep window.
Coaching tips:
- Reverse-engineer bedtime from your fixed wake time. If you need 7.5 hours of sleep, be in bed 8–8.5 hours before your alarm.
- Anchor wake time on weekends. If you sleep in, keep it within ~60–90 minutes of weekdays and add a short early afternoon nap instead.
- Nudge, don’t overhaul. Shift schedules in 15–30 minute steps every few days. Large jumps break regularity.
- Pair with daytime signals. Morning resting heart rate and HRV track recovery; see practical advice in RHR and HRV tracking.
Remember: do not let a single “bad” number override how you feel. A solid week beats a perfect night.
Sleep Staging: Why It’s Approximate (and How to Use It)
Consumer devices label epochs as light, deep, REM, or wake using motion plus autonomic patterns. Without EEG, they infer brain states indirectly. That is why stage minutes jump around even when you feel similar from night to night. Treat staging as a trend indicator rather than a clinical measure.
What staging can do for you:
- Spot big shifts. After a long-haul flight, illness, or heavy training, deep sleep and REM often change markedly. Large, sustained swings (e.g., deep sleep down >25% for a week) can flag strain, under-recovery, or schedule disruption.
- Guide bedtime routines. If “time to fall asleep” and early-night awakenings are trending up, caffeine timing, late exercise, or late meals may be the culprit.
- Track recovery blocks. REM often rebounds after deprivation; deep sleep often rises after heavy strength work. Look for patterns across weeks, not nights.
What staging cannot do:
- Diagnose disorders. Devices cannot rule in or out sleep apnea, narcolepsy, periodic limb movement disorder, or parasomnias. They may hint at fragmentation or snoring, but diagnosis requires a clinical pathway.
- Measure brain restoration. “Deep sleep minutes” on a device do not equal slow-wave EEG quality.
How to read staging responsibly:
- Focus on percentages and weekly medians. Nightly deep sleep bouncing between, say, 13–22% is normal with consumer algorithms. Aim for a stable range over time.
- Watch for method changes. Firmware updates can shift staging behavior. If you see a sudden step-change across all users of the same device (community forums often notice), annotate your data for that date.
- Prioritize sleep efficiency (time asleep divided by time in bed). It integrates awakenings and is less sensitive to staging quirks.
- Consider context from health markers. If staging looks “off” while inflammation markers or illness symptoms are up, the signal is probably real—even if minutes are not exact. See practical testing notes in inflammation markers.
Bottom line: staging is a directional tool. Use it to nudge habits, not as a score to “win.”
Improving Accuracy: Placement, Settings, and Charging Habits
You can make your data cleaner—without buying a new device—by tightening how you wear, configure, and maintain it.
Placement and fit
- Wrist wearables: Wear the device snug but comfortable so the sensor does not float during low perfusion. If you have cold hands, a slightly tighter fit or moving the band 1–2 finger-widths up the forearm can improve PPG signal.
- Rings: Ensure correct sizing; loose rings bounce and degrade HRV data. Wear on the non-dominant hand to reduce motion artifacts.
- Under-mattress pads / radar devices: Follow alignment instructions precisely (e.g., chest level, centered). Recalibrate after changing mattresses or bed frames.
Settings that matter
- Enable “sleep mode” or “bedtime schedule.” This primes algorithms to look for a sleep window and reduces notifications that disrupt sleep.
- Turn on advanced HRV/SpO₂ logging if available. High-resolution PPG yields better sleep-wake detection and steadier respiratory estimates.
- Manual tags. Use tags (caffeine, late meal, alcohol, travel, illness) to explain outliers later.
Charging and maintenance
- Top up before bed. A 20–30 minute charge during the evening routine ensures overnight logging without mid-sleep dropouts.
- Firmware and app updates. Update outside your usual sleep time. After a major update, expect staging behavior to shift—note the date.
- Skin contact hygiene. Clean the sensor window weekly. Oils and lotion films reduce optical signal quality.
Behavioral confounders
- Alcohol (even one drink close to bedtime) increases heart rate, suppresses HRV, fragments sleep, and often shortens REM in the first half of the night. Expect higher resting heart rate and lower HRV for 1–2 nights.
- Late heavy meals or high-fat dinners can raise heart rate and cause prolonged “light sleep” classification.
- Hard evening workouts shift autonomic tone; if you train late, cool down longer and finish ≥3 hours before bedtime.
- Illness raises temperature and heart rate. Tag these nights rather than “fixing” your routine based on temporary changes.
Cross-checks that help
- Compare your device’s time-in-bed to a quick manual note (in-bed, lights-out, final wake). If the device regularly misses your true sleep window, adjust its sensitivity or bedtime schedule.
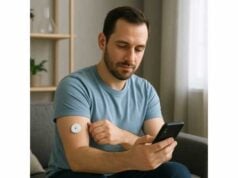
- If you also track glucose, borrow setup ideas from sensor setup lessons: plan charging windows, verify data after firmware updates, and keep a short log of changes.
You cannot remove all noise, but you can make enough improvements to trust trends.
Orthosomnia: Avoiding Obsession with Sleep Scores
“Orthosomnia” describes anxiety and sleep disruption caused by striving for perfect tracker metrics. If you find yourself checking scores before you check in with your body, it is time to reset your approach.
Signals that tracking is working against you
- You sleep worse after seeing a mediocre score, even if you felt fine on waking.
- You keep changing bedtime to chase more deep or REM minutes, and your regularity suffers.
- You frequently repeat sleep (return to bed) just to raise a score.
- You ruminate over single-night fluctuations and feel compelled to “fix” them immediately.
Reframe the tool
- Treat scores like weather—useful for planning, not a judgment. Look at weekly summaries first; open nightly details only if you notice a pattern.
- Set process goals (consistent wind-down, cool dark room, no alcohol on weeknights) rather than outcome goals (X minutes of deep sleep).
- Build your anchor around how you feel by midday: energy, mood, appetite stability, training tolerance. If those improve, the tool is doing its job—even if a stage line wiggles.
Practical guardrails
- Check once per day (late morning). Disable lock-screen summaries.
- Define “good enough.” For many adults: 7–8 hours TST average, ≤60-minute day-to-day swing in sleep timing, and a stable weekly resting heart rate. Everything else is refinement.
- Use tags, not tweaks. If you broke routine (late dinner, travel), add a tag and move on. Do not try to “repair” a single number with dramatic changes that cost regularity.
- Shift energy into daytime levers that actually improve sleep at night: sunlight exposure within 1 hour of waking, 10–20 minutes of light-to-moderate activity by afternoon, and consistent meals. Strength work and body composition efforts (see strength and body composition) often help sleep quality indirectly via metabolic and hormonal pathways.
If your relationship with the device feels tense, take a two-week holiday from scores while keeping your routine. Many people sleep better—and the data looks better—after the break.
When to Seek a Clinical Sleep Study
Wearables are for wellness tracking. Certain patterns, symptoms, or risks call for clinical evaluation with a sleep specialist and appropriate testing (home sleep apnea testing or in-lab polysomnography).
Talk to your clinician if you notice:
- Loud snoring, witnessed pauses in breathing, or gasping at night.
- Excessive daytime sleepiness (dozing while sitting, driving, or in meetings), morning headaches, or nonrestorative sleep despite adequate time in bed.
- Resistant hypertension, atrial fibrillation, type 2 diabetes, or obesity along with sleep symptoms. Sleep apnea is common and treatable in these contexts.
- Parasomnia red flags: violent dream enactment, complex behaviors at night, frequent injurious movements, or seizures.
- Restless legs or repetitive jerks that disrupt you or your bed partner.
- Extreme irregularity you cannot fix with routine changes (e.g., delayed sleep-wake phase that keeps drifting later).
Device patterns that may support referral (not diagnostic):
- Very low sleep efficiency (<80%) most nights.
- Frequent arousals or fragmented sleep without clear behavioral triggers.
- Sustained oxygen desaturations or frequent “disturbances” during the night (on devices that track these).
- Marked heart rate instability at night unrelated to known triggers.
What to expect from clinical testing
- Home sleep apnea test (HSAT) measures breathing, airflow, oxygen saturation, and effort. It is useful when moderate to severe obstructive sleep apnea (OSA) is suspected without significant comorbidity.
- In-lab polysomnography (PSG) adds EEG, eye movements, muscle tone, limb movements, and more. It is the gold standard for complex cases, parasomnias, narcolepsy, movement disorders, or inconclusive HSAT.
- Treatment improves healthspan. Effective OSA treatment (e.g., CPAP, oral appliance, weight loss, positional therapy) can improve blood pressure, daytime function, and bed partner harmony. If you already track cardiovascular markers at home, align your plan with home blood pressure trends.
Prepare a helpful data packet
- Bring two to four weeks of sleep-wake logs (or screenshots), a brief medication list, and bed partner observations.
- Flag nights with alcohol, illness, late training, or travel so your clinician can interpret device trends accurately.
Clinical care is not a last resort—it is the right tool for the right job.
Making a Simple Weekly Sleep Dashboard
A good dashboard is simple, repeatable, and visual. You can build it with any notes app or spreadsheet and update it in 5 minutes on the same day each week.
What to include
- Sleep schedule block
- Bedtime average and wake time average (7-day).
- Mid-sleep (halfway point) and range (earliest vs latest).
- Regularity flag: “On target” if within ±45–60 minutes of baseline on ≥5 days; otherwise “Off target.”
- Sleep quantity and efficiency
- Total sleep time (7-day average) and change vs 28-day baseline.
- Sleep efficiency (time asleep / time in bed). Flag if <80%.
- Recovery context
- Resting heart rate (weekly average vs baseline).
- HRV (weekly average vs baseline).
- Temperature deviation (if available).
- Lifestyle tags
- Count of nights with alcohol, late meals, late training, travel, illness.
- Notes on function
- 1–2 lines: energy, mood, appetite control, training performance.
Weekly workflow (10 steps, ~5 minutes)
- Export or view last 7 days in your wearable app.
- Record bedtime, wake time, TST averages.
- Note mid-sleep and range.
- Add sleep efficiency if available.
- Record resting heart rate and HRV averages.
- Jot temperature trend if your device tracks it.
- Count lifestyle tags.
- Compare to 28-day baseline.
- Choose one focus (e.g., finish dinner by 8 p.m.).
- Schedule one experiment for the next week (e.g., move strength workout to late afternoon).
How to use the dashboard
- If regularity is off, fix that first. It amplifies every other change.
- If you average <7 hours TST, add 15–30 minutes to your sleep window and hold for two weeks.
- If resting heart rate creeps up and HRV dips for >3 nights without an obvious tag, scale back training volume, front-load carbs earlier in the day, and prioritize a calmer evening routine.
- If efficiency is low but TST is adequate, focus on wind-down, caffeine timing (cut off ≥8 hours before bed), and light exposure (morning bright light; dim lights 2 hours before bed).
The best dashboard is the one you consistently use. Keep it light, visual, and focused on decisions you can make today.
References
- Consumer Sleep Technology: An American Academy of Sleep Medicine Position Statement 2018 (Position Statement)
- Clinical practice guideline for diagnostic testing for adult obstructive sleep apnea: an American Academy of Sleep Medicine clinical practice guideline 2017 (Guideline)
- Sleep regularity is a stronger predictor of mortality risk than sleep duration: A prospective cohort study 2024
- Accuracy of 11 Wearable, Nearable, and Airable Consumer Sleep Trackers: Prospective Multicenter Validation Study 2023
- Accuracy of Three Commercial Wearable Devices for Sleep Tracking in Healthy Adults 2024
Disclaimer
This article is for educational purposes only and does not substitute for personalized medical advice, diagnosis, or treatment. Do not ignore or delay seeking professional guidance because of information here. If you have symptoms such as loud snoring, witnessed breathing pauses, excessive sleepiness, or concerns about your sleep data, consult a qualified clinician or a board-certified sleep specialist.
If you found this guide useful, please consider sharing it on Facebook, X, or your preferred platform, and follow us for future updates. Your support helps us continue producing careful, practical content.


