Vitamin D sits at the intersection of bone strength, muscle performance, and long-term independence. Yet many people still wonder what to test, how to time it, and when a number is meaningful. This guide focuses on the practical details that matter in everyday care. You will find clear steps for ordering the right test, converting units, interpreting results alongside symptoms and bone data, and choosing a retesting cadence that reflects how quickly levels change. We also explain sources of laboratory variation and what “good” quality control looks like, so you can tell signal from noise. If you track multiple metrics for prevention, consider our companion resource on longevity biomarkers and tools to build a sustainable routine. The goal is not to chase a perfect value—it is to use a precise, well-timed measurement that helps you protect mobility, reduce fracture risk, and maintain healthspan.
Table of Contents
- Which Test to Order: 25(OH)D and Assay Variants
- Units and Seasons: ng/mL vs nmol/L and Timing
- Interpreting Levels in Context (Symptoms, Bone, and Risk)
- Retesting Cadence: How Long Changes Take to Appear
- Assay Variability and Lab Quality
- When to Discuss Results with Your Clinician
- Logging Levels Over the Year
Which Test to Order: 25(OH)D and Assay Variants
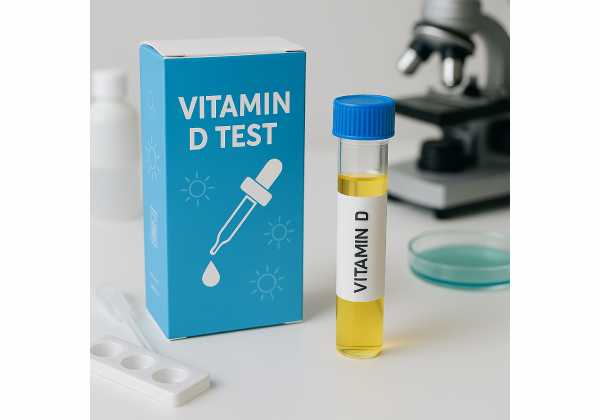
Order serum 25-hydroxyvitamin D [25(OH)D], not 1,25-dihydroxyvitamin D. The 25(OH)D concentration reflects total vitamin D input from sunlight, diet, and supplements. It also has a longer half-life (about two to three weeks), so it tracks status, not moment-to-moment flux. By contrast, the active hormone 1,25(OH)2D is tightly regulated by parathyroid hormone and kidney function; it can be normal—or even high—when you are frankly deficient. Unless your clinician is evaluating specific kidney or parathyroid disorders, 1,25(OH)2D is not a suitable screening test.
Most reports show total 25(OH)D, the sum of 25(OH)D3 (from cholecalciferol and sun) and 25(OH)D2 (from ergocalciferol). This distinction matters if you take D2; some antibody-based assays under-recover D2, which can make results look lower than they are. If your report lists separate D2 and D3 values, their sum should closely match the total (allowing for rounding). When in doubt, ask your lab which method it uses and how it handles D2.
Assay choices. Two broad methods dominate.
- LC–MS/MS (liquid chromatography–tandem mass spectrometry): separates D2, D3, and certain epimers before quantifying them. It is often treated as the reference approach in accuracy programs. Advantages include specificity and lower cross-reactivity; disadvantages include higher cost and complexity.
- Automated immunoassays: high-throughput and widely available, with improving performance in recent generations. However, they may show bias at low or high concentrations or in special populations (e.g., pregnancy) and can variably detect D2.
Standardization matters. Many laboratories align their methods with internationally recognized reference procedures and participate in external quality assessments. Standardization reduces inter-lab bias, so your trends reflect real physiology rather than method drift. If your history includes high-dose D2 therapy, pregnancy, or unusual results, consider a lab with LC–MS/MS or a well-validated immunoassay for D2 recovery.
What to order and when to bundle.
- Primary order: serum total 25(OH)D.
- Consider bundling calcium, creatinine, and phosphorus if you are adjusting dose, have symptoms, or plan bone-active therapy. Parathyroid hormone (PTH) adds value when results are borderline or symptoms suggest dysregulation of calcium metabolism.
- Free 25(OH)D and vitamin D–binding protein tests are generally research tools or for specific clinical scenarios, not routine status checks.
Practical steps for cleaner data: keep collection conditions consistent (time of day, fasting status, and season), avoid major changes in supplementation in the two weeks before a status-defining test, and use the same lab when you are trending.
Bottom line: choose total 25(OH)D measured by a reliable, standardized method, repeat under similar conditions, and interpret with calcium and kidney context when needed.
Units and Seasons: ng/mL vs nmol/L and Timing
Vitamin D status speaks two “languages.” U.S. and some Latin American labs report ng/mL; many other regions report nmol/L. The conversion is simple and worth memorizing if you read global literature or switch care settings:
- ng/mL × 2.5 = nmol/L
- nmol/L ÷ 2.5 = ng/mL
Because sunlight drives cutaneous synthesis, seasonal swings are normal—especially at higher latitudes, in people who cover their skin, and in those who spend most hours indoors. Many adults see winter drops of roughly 5–15 ng/mL (12–37 nmol/L) compared with late-summer peaks, though the amplitude varies with skin pigmentation, age, outdoor time, sunscreen use, and latitude. Two neighbors in the same city can differ by more than 10 ng/mL over a year simply because one commutes by bike and the other works in a windowless office.
How to time your check.
- If you want a single steady waypoint, test at the same point each year. Late winter is popular because it captures the trough and helps plan dosing for the least sunny months.
- If you just changed your dose, habit, or sun exposure, wait long enough for a meaningful shift (see the retesting section) before drawing a decision-making lab.
- After a sunny trip, allow three to four weeks to settle before testing a value you will use for long-term planning.
Day-to-day details are less important than season but still help when you trend: test at a similar time of day and keep routines typical in the 48 hours prior. Hydration, a normal breakfast, and light activity do not materially affect 25(OH)D; radical changes (e.g., outdoor marathons plus heavy sun) can.
Know your personal amplitude.
- If your trough is around 20–25 ng/mL (50–62 nmol/L) and your peak is 30–35 ng/mL (75–87 nmol/L), small habit changes may be all you need.
- If your trough dips below 12 ng/mL (30 nmol/L), plan a structured repletion phase, then retest to confirm that your maintenance dose holds you above your target through winter.
Practical logging tip. Put your conversion and seasonal notes in the same place you track other health data. If you already use wearables for sleep and recovery, you can adapt that routine to a twice-yearly vitamin D checkpoint—no new app required. For general device advice, our primer on sleep wearables guidance can help you decide how to integrate measurements into daily life without adding complexity.
Your aim is a repeatable schedule that turns single snapshots into a sensible, year-round plan.
Interpreting Levels in Context (Symptoms, Bone, and Risk)
A vitamin D number has meaning only in context. Bone mineralization depends on adequate vitamin D, calcium balance, and loading from activity. Muscle function, balance, and fall risk also interact with broader health and medications. Use the lab value to inform—not replace—clinical judgment.
Common thresholds used in practice
- Deficiency risk: <12 ng/mL (30 nmol/L) — associated with osteomalacia in adults and rickets in children.
- Potential inadequacy: 12–19 ng/mL (30–49 nmol/L) — some people need more, depending on diet, symptoms, and bone status.
- Generally sufficient for most adults: ≥20 ng/mL (≥50 nmol/L) — supports population-level bone outcomes.
- Targets often used in bone clinics: ≥30 ng/mL (≥75 nmol/L) for people with osteoporosis, prior fragility fracture, malabsorption, or on therapies that require adequate vitamin D to work optimally.
- High values with limited added benefit for most: >50 ng/mL (125 nmol/L) — at this range, carefully reassess dosing and calcium metabolism, particularly if other risks exist.
Symptoms and signs are nonspecific. Diffuse bone pain, proximal muscle weakness, slow chair rise, and frequent stumbles may reflect low vitamin D, but they also overlap with deconditioning, neuropathy, or other deficiencies (e.g., B12). If symptoms persist, test rather than guess, and evaluate comprehensively.
Bone data sharpen interpretation.
- If you carry a low-trauma fracture history or confirmed osteoporosis, define your vitamin D target in service of that condition. Many bone clinics aim for ≥30 ng/mL to support antiresorptive or anabolic therapy.
- If your bone density scan is borderline and your vitamin D sits in the teens, a focused correction is reasonable before attributing changes solely to age or genetics. For imaging context and timing, see our guide to bone density scans.
Kidney, parathyroid, and calcium context.
- Secondary hyperparathyroidism (elevated PTH) with low-normal 25(OH)D suggests your system wants more substrate or you have malabsorption.
- Suppressed PTH with high 25(OH)D and any hypercalcemia raises the risk of overtreatment.
- Chronic kidney disease changes vitamin D activation and phosphate handling; thresholds and safety monitoring should align with renal priorities.
Medications and comorbidities
- May lower levels or increase needs: glucocorticoids, certain anticonvulsants, rifampin, antiretrovirals; malabsorption syndromes such as celiac disease, IBD, or post-bariatric surgery.
- May heighten risk when levels are high: thiazide diuretics increase calcium reabsorption, so pairing high-dose vitamin D with thiazides can predispose to hypercalcemia in susceptible individuals.
Practical framing
- An active adult with normal kidneys, no fracture history, and 25(OH)D around 20–30 ng/mL is likely in a reasonable range; consistent habits and periodic checks suffice.
- Someone with osteoporosis and 25(OH)D at 15 ng/mL should correct first, then maintain.
- A person with >60–80 ng/mL without a specific indication should pause high-dose products, review overlapping supplements, and retest with calcium and creatinine.
Use thresholds to guide action, then personalize based on symptoms, bone health, and coexisting conditions.
Retesting Cadence: How Long Changes Take to Appear
Vitamin D levels do not move overnight. Understanding the timeline prevents both false reassurance and overcorrection.
Kinetics in plain terms. The circulating half-life of 25(OH)D is about two to three weeks, but you need 8–12 weeks for a new intake pattern to reach a practical steady state. Cutaneous synthesis complicates the picture: a sunny month nudges levels up gradually; overcast weeks nudge them down.
When to recheck
- After a dose change or new regimen: retest in 8–12 weeks. Earlier checks often underrepresent the full effect.
- After a sunny trip: wait three to four weeks before drawing a status-defining lab.
- Stable adults in good health: once per year at the same seasonal point (often late winter) is reasonable.
- Higher-risk scenarios (osteoporosis therapy, malabsorption, CKD, or medications affecting vitamin D): consider every 3–6 months until stable, then annually.
Responding to results
- Small shortfalls (e.g., 18–22 ng/mL with normal bone health): tighten habits—consistent supplement use, dietary sources, and modest safe sun exposure aligned with dermatology guidance—then recheck in 8–12 weeks.
- Marked deficiency (<12 ng/mL) or symptoms consistent with osteomalacia: your clinician may prescribe structured repletion, followed by maintenance and a check at 8–12 weeks to confirm the plan.
- Unexpectedly high values (>50–60 ng/mL): stop any high-dose products, review labels for overlapping vitamin D sources (multivitamin, fortified foods, cod liver oil), and recheck in 4–8 weeks with calcium and creatinine.
Aligning with other lab rhythms. Many readers batch vitamin D checks alongside quarterly or semiannual metabolic labs to simplify scheduling and keep routines consistent. If you already track metabolic health, our primer on glucose and insulin testing shows how to coordinate timelines so you are not drawing blood every month without a clear question.
Timing pitfalls to avoid
- Testing too soon after a change, then escalating dose based on partial response.
- Testing right after unusual UV exposure, which can overestimate your typical trough.
- Ignoring adherence and formulation (D2 vs D3), which can create swings that look like seasonal change.
Set a steady cadence, anchor it to season, and use each check to confirm direction rather than micromanage week-to-week noise.
Assay Variability and Lab Quality
Two people can draw blood on the same day and receive different numbers because assays, calibration, and handling differ. That variability is shrinking, but near decision thresholds it still counts.
Sources of variation
- Analytical method: Immunoassays rely on antibodies and can cross-react differently with metabolites such as 3-epi-25(OH)D or detect D2 less efficiently than D3. LC–MS/MS physically separates analytes, reducing cross-reactivity, but requires careful calibration and skilled operation.
- Calibration and traceability: Accuracy programs that align results with reference methods reduce inter-lab bias. Participation in external quality assessments is a good sign.
- Matrix effects and populations: Pregnancy, liver disease, and high-dose D2 therapy can challenge some platforms.
- Preanalytic factors: Storage time, temperature, and transport conditions can nudge results, especially in multicenter settings.
What “good” looks like
- Coefficient of variation (CV) at or below ~10% and mean bias within about ±5% relative to reference procedures are reasonable performance markers.
- Transparent reporting: Your lab indicates the method (e.g., LC–MS/MS or specific immunoassay platform) and notes major method changes.
- Consistency over time: If your lab switches platforms, treat the first post-change result with caution and, if possible, pair it with a same-day repeat to anchor your trend.
Practical steps for individuals
- Use the same lab whenever you are trending. Cross-lab comparisons invite noise.
- If you are taking D2 or have special circumstances, consider a lab with LC–MS/MS or confirm the chosen immunoassay has good D2 recovery.
- Keep your own metadata: date, time, supplement dose and brand, adherence, recent sun exposure, intercurrent illness. If a result surprises you, these details speed root-cause review.
Lessons from other biomarkers. The principle—pick a validated method, then be consistent—applies across health tracking. If you also measure fatty acid status, our overview of omega-3 index testing explains how method choice and standardization shape decision-making there, too.
Bottom line: seek method consistency and quality alignment so changes on paper reflect changes in you, not the machine.
When to Discuss Results with Your Clinician
Most healthy adults can manage vitamin D with routine testing and sensible habits. Still, certain results or situations warrant a clinical conversation.
Clear flags for consultation
- Very low levels (<12 ng/mL / 30 nmol/L) or symptoms suggestive of osteomalacia (bone pain, proximal muscle weakness, trouble rising from a chair).
- Recurrent falls or fragility fractures, known osteoporosis, or plans to start antiresorptive or anabolic therapy.
- Chronic kidney disease, malabsorption (celiac disease, inflammatory bowel disease, post-bariatric surgery), liver disease, or hyperparathyroidism.
- High levels (>50–60 ng/mL / 125–150 nmol/L) without a clear indication, or any hypercalcemia, nephrolithiasis, or concerning ECG changes.
- Complex medication regimens (thiazides, anticonvulsants, rifampin, antiretrovirals, glucocorticoids).
What to bring
- Your last year of labs: 25(OH)D with dates, calcium, creatinine, phosphorus, and PTH if available.
- A complete supplement list with exact micrograms (mcg) or international units (IU) per day and brand names—remember 1 mcg = 40 IU. Many multivitamins, fortified foods, and separate vitamin D products stack unintentionally.
- Context notes: sun exposure pattern, recent travel, sunscreen habits, clothing coverage, GI symptoms, and adherence.
Topics to clarify together
- Targets aligned with your diagnosis and risk (e.g., osteoporosis vs general prevention).
- Formulation (D3 vs D2), dose, and schedule.
- Follow-up interval and which companion labs to check for safety and efficacy.
- Interactions with calcium supplements, thiazides, or other drugs affecting calcium balance.
If kidney markers are already in your tracking routine, revisit how vitamin D integrates with renal care; our primer on kidney markers outlines eGFR and albuminuria basics that often shape dosing and monitoring.
Clinicians help calibrate the risk-benefit balance: enough vitamin D for bone integrity and function, not so much that calcium metabolism tips toward harm.
Logging Levels Over the Year
A simple log turns scattered values into a pattern you can use. It does not have to be fancy; a notes app, spreadsheet, or the tracker inside your patient portal works. The goal is consistency and context, not data for its own sake.
Record this each time you test
- Date and season (or latitude if you traveled).
- 25(OH)D value and units (ng/mL or nmol/L). Note any lab method changes.
- Calcium and creatinine (and PTH if checked).
- Supplement dose and form (D3 or D2), brand, and adherence over the prior month.
- Sun exposure pattern: weekday vs weekend, average minutes outdoors, sunscreen habits.
- Dietary notes: dairy intake, fortified foods, major dietary shifts (e.g., vegan transition).
- Symptoms: bone pain, proximal weakness, balance issues, falls.
How to review quarterly
- Spot the seasonal curve. Most people crest late summer and trough late winter. Knowing your amplitude helps you set realistic targets and avoid overcorrecting.
- Check for drift. If your winter trough was 28 ng/mL two years ago and is 21 ng/mL now with the same plan, something changed—adherence, supplement potency, sun, body mass, or lab method.
- Align with goals. If you are starting osteoporosis treatment, ensure your trough stays at or above the target your clinician recommends.
- Audit safety. Persistent values above 50–60 ng/mL call for a supplement review, especially if calcium is high or you use thiazides.
Keep the log lean. You do not need weekly entries. Two to four measurements per year, recorded with context, usually reveal more than a dozen scattered readings. If you are already tracking other health metrics, reuse the same rhythm: consistent timing, simple fields, and a brief note on what changed.
Guardrails for everyday decisions
- Micrograms and IU: verify labels; 1 mcg = 40 IU.
- Travel: if you take a sunny trip in winter, mark it and avoid drawing a long-term decision lab immediately afterward.
- Storage and adherence: set a simple routine—same time of day, pillbox checks, and periodic label review to avoid “multi plus D plus cod liver oil” stacking.
Over a year or two, your log will show your personal seasonal curve, the smallest effective dose to hold your trough above target, and early signs when drift begins—before it becomes a problem.
References
- Vitamin D for the Prevention of Disease: An Endocrine Society Clinical Practice Guideline (2024) (Guideline)
- Screening for Vitamin D Deficiency in Adults: US Preventive Services Task Force Recommendation Statement (2021) (Guideline)
- Vitamin D Standardization Program (VDSP) Intralaboratory Study for the Assessment of 25-Hydroxyvitamin D Assay Variability and Bias (2021)
- 25-hydroxyvitamin D assay standardisation and vitamin D guidelines paralysis (2020) (Review)
- Vitamin D – Health Professional Fact Sheet (2025)
Disclaimer
This article is for education and planning, not a substitute for personalized medical advice, diagnosis, or treatment. Do not start, stop, or change supplements or medications based solely on this content. Discuss your results, symptoms, and goals with a qualified clinician—especially if you have osteoporosis, kidney disease, malabsorption, or take medicines that affect calcium balance.
If you found this guide helpful, please consider sharing it on Facebook, X (formerly Twitter), or any platform you prefer, and follow us for future updates. Your support helps us continue producing clear, practical health content.


