
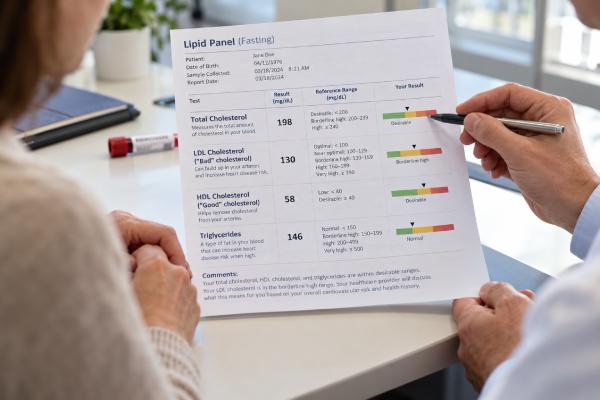
A “normal” cholesterol level depends on which number you are looking at and your cardiovascular risk. For a general adult lipid panel, total cholesterol below 200 mg/dL, triglycerides below 150 mg/dL, and LDL cholesterol below 100 mg/dL are commonly considered favorable. HDL cholesterol is different: low HDL can be a risk marker, but higher is not automatically better, and HDL is not treated like LDL.
Current cholesterol guidelines go beyond simple reference ranges. Someone with established cardiovascular disease may need an LDL target below 70 mg/dL or even below 55 mg/dL, while a lower-risk adult may have a less aggressive goal. Triglycerides, non-HDL cholesterol, apolipoprotein B, and lipoprotein(a) can also change how risk is judged.
The key is to separate a laboratory “desirable range” from a personal treatment target. Your numbers should be interpreted alongside age, blood pressure, diabetes, smoking, kidney disease, family history, existing artery disease, and other risk factors.
Table of Contents
- Common Cholesterol Ranges for Adults
- LDL Targets Depend on Cardiovascular Risk
- What HDL Levels Mean
- Triglyceride Ranges and When They Matter
- Non-HDL Cholesterol and ApoB
- How to Interpret Your Lipid Panel
- When to Repeat Cholesterol Testing
Common Cholesterol Ranges for Adults
The most familiar cholesterol ranges are screening categories, not one-size-fits-all treatment goals. A standard lipid panel usually includes total cholesterol, LDL cholesterol, HDL cholesterol, and triglycerides.
| Test | Common adult range | Basic interpretation |
|---|---|---|
| Total cholesterol | Below 200 mg/dL | Generally considered desirable |
| LDL-C | Below 100 mg/dL | Favorable for many adults, but high-risk patients may need much lower levels |
| HDL-C | Low if below about 40 mg/dL in men or 50 mg/dL in women | Risk marker rather than a direct treatment target |
| Triglycerides | Below 150 mg/dL | Generally considered normal |
| Non-HDL-C | Often interpreted relative to LDL and overall risk | Captures cholesterol in all major atherogenic particles |
Total cholesterol is the least specific of these numbers. It combines cholesterol carried in LDL, HDL, and other lipoproteins. A total cholesterol of 205 mg/dL can have very different meaning depending on whether the extra cholesterol is mainly in LDL or HDL.
LDL-C is usually the most important number for atherosclerotic risk and treatment. LDL particles can enter the artery wall, where retained cholesterol contributes to plaque formation. The lower your long-term exposure to LDL and other atherogenic particles, the lower your risk tends to be.
HDL-C is often labeled “good cholesterol,” but that phrase can be misleading. HDL is associated with cardiovascular risk, yet simply raising the HDL number has not reliably reduced heart attacks or strokes. A low HDL level can be a clue to metabolic risk, especially when triglycerides are high.
Triglycerides are a different type of fat. They often rise with insulin resistance, excess alcohol, poorly controlled diabetes, obesity, and high intake of refined carbohydrates. If you need a basic review of what each lipid represents, LDL, HDL, and triglycerides explained provides the underlying physiology.
mg/dL versus mmol/L
Lipid values are reported in different units around the world. In the United States, mg/dL is standard. Many other countries use mmol/L. The same blood sample can therefore appear to have very different numbers even though the concentration is identical.
Approximate conversions are useful when reading international guidance:
- For total cholesterol, LDL-C, and HDL-C, divide mg/dL by about 38.7 to get mmol/L.
- For triglycerides, divide mg/dL by about 88.6 to get mmol/L.
For example, LDL-C of 100 mg/dL is about 2.6 mmol/L, and triglycerides of 150 mg/dL are about 1.7 mmol/L. When comparing results over time, use the same unit system whenever possible.
Another source of confusion is the laboratory’s “reference interval.” A lab may flag a result according to a broad population range, while a clinician may use a tighter treatment goal because the person has coronary disease or another high-risk condition. The treatment target should take priority over the generic flag when the two differ.
LDL Targets Depend on Cardiovascular Risk
There is no single LDL number that is “normal enough” for everyone. Current U.S. guidance again uses LDL-C and non-HDL-C treatment goals, with more aggressive targets for higher-risk patients.
The 2026 ACC/AHA dyslipidemia guideline recommends different goals based on risk. Broadly:
| Risk situation | Example LDL-C goal | Why the goal is lower |
|---|---|---|
| Borderline or intermediate primary-prevention risk | Below 100 mg/dL | Reduces lifetime exposure to atherogenic cholesterol |
| High primary-prevention risk | Below 70 mg/dL | Higher absolute risk creates greater benefit from LDL lowering |
| Established ASCVD at very high risk | Below 55 mg/dL | Secondary prevention aims to reduce recurrent events |
These are treatment goals, not “normal laboratory ranges.” A person who has already had a heart attack may have an LDL of 82 mg/dL, which looks favorable on many lab reports, yet still be above the recommended treatment goal for that risk level.
At the other end, an LDL of 190 mg/dL or higher is considered severe hypercholesterolemia and usually warrants prompt clinical evaluation. Such levels can reflect familial hypercholesterolemia, especially when there is a family history of early heart attack or stroke. Lifestyle habits matter, but genetics can dominate at this level.
Risk assessment is especially important when LDL is between about 70 and 189 mg/dL. The 2026 U.S. guideline uses PREVENT-ASCVD equations for many adults to estimate 10-year risk and may also consider risk-enhancing factors, coronary artery calcium, family history, chronic inflammatory disease, kidney disease, and other information.
The practical lesson is simple: do not stop at the lab’s reference flag. Ask whether your LDL is appropriate for your personal risk. A result can be inside the laboratory range but still above your cardiovascular target.
Why the same LDL can mean different things in two people
Suppose two adults each have LDL-C of 118 mg/dL. One is 32, does not smoke, has normal blood pressure, no diabetes, no kidney disease, and no strong family history. The other is 67 and has diabetes, chronic kidney disease, and coronary artery disease. The laboratory number is identical, but the expected benefit from lowering LDL is very different.
That is why modern guidelines pair the lipid panel with absolute cardiovascular risk. Treatment decisions may consider age, sex, blood pressure, smoking, diabetes, kidney function, family history, inflammatory disease, reproductive history, lipoprotein(a), and evidence of plaque on imaging. In uncertain cases, coronary artery calcium scoring can sometimes help reclassify risk.
Lifetime exposure also matters. An LDL of 165 mg/dL at age 35 may not produce a high 10-year risk estimate, simply because the person is young, yet decades of exposure can still matter. The 2026 guideline therefore emphasizes earlier prevention and considers treatment in selected younger adults with LDL-C in the 160–189 mg/dL range or a strong family history of premature atherosclerotic disease.
What HDL Levels Mean
HDL is useful as a risk marker, but it is not a number to maximize at all costs. Low HDL commonly travels with insulin resistance, abdominal obesity, smoking, inactivity, and high triglycerides. Those conditions are important because they increase cardiovascular risk through several pathways.
Commonly used low-HDL cutoffs are:
- Below 40 mg/dL in men.
- Below 50 mg/dL in women.
Older teaching often described HDL of 60 mg/dL or higher as strongly protective. That idea is now more nuanced. Observational studies show that low HDL is associated with higher risk, but drug trials that raised HDL did not consistently reduce cardiovascular events. More recent evidence also suggests that very high HDL is not automatically protective.
This means treatment generally focuses on the causes and accompanying risks rather than prescribing therapy solely to raise HDL. Helpful actions include regular activity, smoking cessation, improved insulin sensitivity, weight management when needed, and a heart-healthy diet.
A person with HDL of 75 mg/dL and LDL of 175 mg/dL should not assume the high HDL cancels out the LDL. Likewise, a person with HDL of 37 mg/dL but excellent LDL, normal triglycerides, healthy blood pressure, no smoking, and low overall risk should not panic over the HDL number alone.
Ratios such as total cholesterol divided by HDL or triglycerides divided by HDL can provide additional context, but they do not replace direct assessment of LDL, non-HDL cholesterol, apoB when appropriate, and total cardiovascular risk. If you are curious about one of these ratios, the triglyceride-to-HDL ratio has a limited but sometimes useful role.
Triglyceride Ranges and When They Matter
Triglycerides below 150 mg/dL are generally considered normal. Levels above that suggest increasing metabolic or cardiovascular risk, while very high values raise concern for pancreatitis.
A common clinical framework is:
| Triglycerides | Typical interpretation |
|---|---|
| Below 150 mg/dL | Normal |
| 150–199 mg/dL | Borderline high |
| 200–499 mg/dL | High |
| 500 mg/dL or higher | Very high; pancreatitis prevention becomes an important concern |
| 1,000 mg/dL or higher | Severe elevation with substantially greater pancreatitis risk |
Triglycerides can change more rapidly than LDL. A large amount of alcohol, poorly controlled blood sugar, recent weight gain, or a high-refined-carbohydrate diet can push them up. Reducing alcohol, losing excess weight, treating diabetes, and changing food quality can lower them within weeks to months.
The cardiovascular risk linked to elevated triglycerides is partly driven by triglyceride-rich lipoproteins and their remnants. These particles carry cholesterol that can contribute to atherosclerosis.
If triglycerides are elevated, the first step is often to look for causes rather than immediately focusing on a supplement. Review alcohol intake, diabetes control, thyroid status, kidney disease, diet, weight changes, and medications. Practical strategies are covered in diet changes that lower triglycerides.
Non-HDL Cholesterol and ApoB
LDL-C does not always capture the full number of cholesterol-carrying particles that can enter artery walls. Two additional measures can help in selected people: non-HDL cholesterol and apolipoprotein B.
Non-HDL-C is calculated as:
Total cholesterol − HDL cholesterol
It includes cholesterol carried in LDL, VLDL, remnant particles, intermediate-density lipoproteins, and lipoprotein(a). Because it does not require a separate test, it is easy to calculate and particularly useful when triglycerides are elevated.
ApoB measures the main structural protein found on atherogenic particles. Since each LDL, VLDL remnant, IDL, and Lp(a) particle carries one apoB molecule, apoB acts as a rough particle count.
Why can this matter? Imagine two people with the same LDL-C of 100 mg/dL. One has relatively few cholesterol-rich LDL particles. The other has many smaller particles, each carrying less cholesterol. Their LDL-C is the same, but their particle number—and potentially risk—may differ.
The 2026 U.S. guideline supports selective apoB testing to refine risk, particularly in people with diabetes, elevated triglycerides, cardiometabolic disease, or very low achieved LDL-C. A dedicated apoB test overview can help explain when it adds value.
Lipoprotein(a), or Lp(a), is another important inherited particle. Current U.S. guidance recommends measuring Lp(a) at least once in adulthood because high levels can increase cardiovascular risk even when the standard lipid panel looks fairly good.
How to Interpret Your Lipid Panel
Interpret the pattern, the trend, and your risk—not just whether the lab placed an “H” or “L” next to a number.
A useful sequence is:
- Start with LDL-C. Is it below the goal appropriate for your risk?
- Check triglycerides. Are they normal, moderately elevated, or high enough to create pancreatitis concern?
- Look at non-HDL-C. This is especially useful when triglycerides are elevated.
- Use HDL as context. Low HDL can support a picture of metabolic risk, but high HDL does not erase high LDL.
- Compare with prior results. A stable long-term pattern means something different from a sudden large change.
- Consider whether extra testing is useful. ApoB, Lp(a), and coronary artery calcium may refine decisions in selected people.
Examples
Example 1: LDL 92, HDL 58, triglycerides 105 mg/dL. This may be a favorable profile for a low-risk adult, but LDL of 92 could still be above goal for someone with prior myocardial infarction.
Example 2: LDL 105, HDL 36, triglycerides 260 mg/dL. The LDL does not look dramatically high, but high triglycerides and low HDL suggest metabolic risk. Non-HDL-C and apoB may provide additional information.
Example 3: LDL 198, HDL 62, triglycerides 90 mg/dL. The high HDL does not neutralize severe LDL elevation. This pattern warrants evaluation for severe hypercholesterolemia and possible familial causes.
Example 4: LDL 48, HDL 44, triglycerides 135 mg/dL in a person taking intensive lipid-lowering therapy after a heart attack. The low LDL may be exactly the intended treatment result rather than “too low.”
Unexpected changes deserve context. Hypothyroidism, uncontrolled diabetes, kidney disease, pregnancy, menopause, major weight changes, some medications, and acute illness can influence lipid levels.
What can temporarily change a cholesterol test?
Lipid levels are not as volatile as blood pressure, but they are not perfectly fixed. Major weight loss, acute illness, pregnancy, thyroid changes, poorly controlled diabetes, and medication changes can shift the pattern. Triglycerides are the most meal-sensitive component and may rise after eating, especially after a large meal or alcohol intake.
A sudden LDL increase also deserves a medication and diet review. Stopping a statin, developing hypothyroidism, or making a major dietary shift toward saturated fat can all raise LDL. Conversely, a large drop after treatment is usually expected and should not be interpreted as a deficiency just because the number is below the population average.
If a result is unexpectedly extreme or does not fit prior measurements, clinicians often confirm it rather than making a permanent treatment decision from one isolated panel. Consistency, clinical context, and the trend over time are more informative than a single outlier.
When to Repeat Cholesterol Testing
Testing frequency depends on risk and whether treatment is changing. A stable low-risk adult may go years between lipid panels, while someone starting or adjusting medication may be retested within weeks to months.
The 2026 U.S. guideline emphasizes regular lipid screening beginning in early adulthood and more frequent monitoring when treatment is active. After starting or changing lipid-lowering therapy, clinicians commonly recheck the panel after about 4 to 12 weeks to confirm the response. Once treatment is stable, testing may be spaced farther apart.
Fasting is not required for every lipid panel. Nonfasting testing works for many routine situations. A fasting sample may be helpful when triglycerides are high, severe hypertriglyceridemia is suspected, or the clinician needs a standardized result.
If a result is surprising, repeat testing can help rule out temporary effects or laboratory variation. Do not make a major medication decision based on one unusual result without considering the full picture.
The central takeaway is that “normal cholesterol” has two layers. General screening ranges help identify common abnormalities, but personal treatment goals depend on cardiovascular risk. LDL-C usually carries the most weight, triglycerides add important metabolic information, HDL is a contextual marker, and non-HDL-C, apoB, and Lp(a) can refine risk when the standard panel is not enough.
Cholesterol results are most useful when compared over time under similar conditions. A single borderline value rarely tells the whole story. Trends, medication changes, weight changes, diabetes control, thyroid status, and recent illness can all affect the panel. When a result seems surprising, confirming it and reviewing the full risk picture is often more useful than focusing on one isolated number.
References
- 2026 Guideline on the Management of Dyslipidemia 2026 (Guideline)
- Top Things to Know: Guideline on the Management of Dyslipidemia 2026 (Guideline)
- 2025 Focused Update of the 2019 ESC/EAS Guidelines for the management of dyslipidaemias 2025 (Guideline)
- 2022 ACC Expert Consensus Decision Pathway on the Role of Nonstatin Therapies for LDL-Cholesterol Lowering in the Management of Atherosclerotic Cardiovascular Disease Risk: A Report of the American College of Cardiology Solution Set Oversight Committee 2022 (Guideline)
- ApoB, LDL-C, and non-HDL-C as markers of cardiovascular risk 2025 (Systematic Review)
- Revisiting high-density lipoprotein cholesterol in cardiovascular disease: Is too much of a good thing always a good thing? 2024 (Review)
Disclaimer
Cholesterol goals depend on your overall cardiovascular risk, medical history, and current treatment, so a laboratory reference range is not a substitute for individualized interpretation. Very high LDL or triglycerides may require prompt medical evaluation. Do not start, stop, or change cholesterol medication without discussing it with a qualified clinician.